Grafana and time series databases
More than a Thousand Words
Storage with a Difference
At this point, databases for time series enter the scene. Although they are much like MySQL databases, their internal structures clearly differ. Time series databases are designed out of the box to save events in their temporal sequence, rather than as individual events. Therefore, they are in a position to respond far faster than with MySQL to a request such as, "What was the CPU load of system x in period y?"
Fortuitously, in a time series, classic, event-based monitoring is also available – almost as a kind of side product – because the defined time period can be just a single point in time (e.g., exactly 30 seconds ago). MAT systems based on time series can therefore be used for classic monitoring as well as for comprehensive trending, and this is precisely where current developments are heading: All monitoring systems that have arisen in recent years rely in the background on a database with a time series structure.
How Does Grafana Work?
The Grafana developers noticed that a number of time series databases were already on the market, but even the prettiest trending data will not help if you cannot somehow visualize it and thus understand it. Grafana slots neatly into this gap. Essentially, Grafana is a server that speaks HTTP(S) and exposes a graphical web interface.
Under the hood, the service has a plugin interface for various back ends (i.e., between Grafana and various time series databases). In the web interface, you determine what information Grafana should show from the respective back end. Grafana then collects the required information and proceeds to generate images. A unified interface presents the most important information from various time series databases at a glance. Because Grafana places great emphasis on flexibility, you can set up its GUI (i.e., the dashboard or control center) to suit your preferences.
Grafana also is easy to install and use. On their website, the developers explain how to install and configure their tool on Red Hat Enterprise Linux, CoreOS, Debian, or Ubuntu. Grafana also can be operated on Windows servers and Macs. For a simple approach, a Docker container comes with Grafana pre-installed, which you can boot on the fly in any Docker environment. Within a few minutes, you have access to a running Grafana in which only the data sources need to be defined.
Support extends from common time series databases such as OpenTSDB and InfluxDB, through Prometheus, to more exotic solutions such as OpenStack Gnocchi. Grafana now even supports databases that are not even genuine time series databases: Elasticsearch is just one example.
In the following sections, I look at the most important back ends and show how Grafana can be used with the respective databases.
Graphite
Graphite [3] is the first in the pageant of Grafana back ends. The phonetic similarity already suggests that the two solutions have something in common: Like Grafana, Graphite lets you visualize metrics data. Unlike Grafana, it is not Graphite's declared main task. Instead, Graphite is primarily a time series database with a GUI added on.
At its core, Graphite comprises three components: Carbon acts as a kind of broker that waits for external agents to deliver metrics, which are then stored in Whisper, the core component of the software (i.e., the time series database). Interestingly, Graphite also comes with a web interface: The tool with the uninspiring name graphite-web can easily visualize data from Whisper. Some admins thus rightly ask why Grafana would need to dock with Graphite.
Basically, a quick look at the two solutions answers this question, because Graphite and Grafana differ greatly in terms of appearance and functionality. Grafana is much more extensive than the Graphite web interface (Figure 1); it also looks far more modern. Grafana indisputably offers clear advantages over Graphite, especially when you need to visualize data from multiple sources in a central interface.
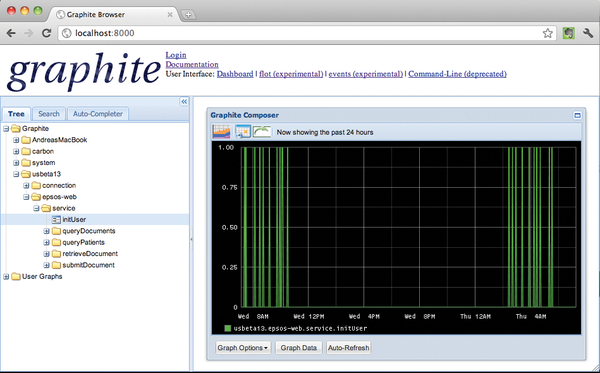 Figure 1: In terms of appearance, Graphite loses out to Grafana.
Grafana visualizes data simply by configuring multiple data sources and building appropriate dashboards. However, Graphite can only output a list of the values that it finds in its own Whisper database. Graphite also does not let you submit your own queries or define special views. Fact is, Grafana is not a drop-in replacement for the Graphite web interface. It offers far more features and is universally usable.
Graphite itself is pretty much useless without a connected monitoring solution providing the data: Generally, admins therefore combine Grafana with Sensu [4] (Figure 2), a complete monitoring environment of a new type that uses Graphite as the storage location for its own user data. People looking for a modern Nagios alternative therefore often end up at the Nagios-compatible Sensu, because it can recycle the well-known Nagios checks.
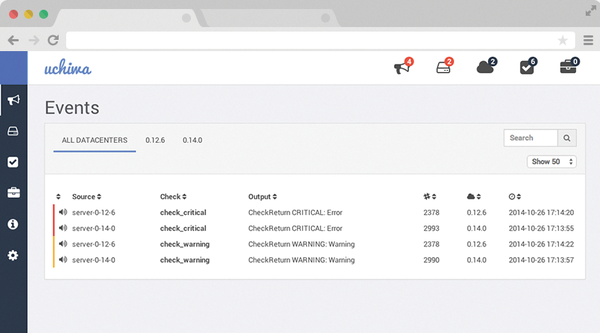 Figure 2: Sensu, here with its Uchiwa graphical front end, builds on a time series database such as Graphite or InfluxDB to provide monitoring.
In combination with Grafana and Sensu, Graphite's primary task is storing data, but you could just as easily dispense with the Graphite web interface if you use Grafana (Figure 3).
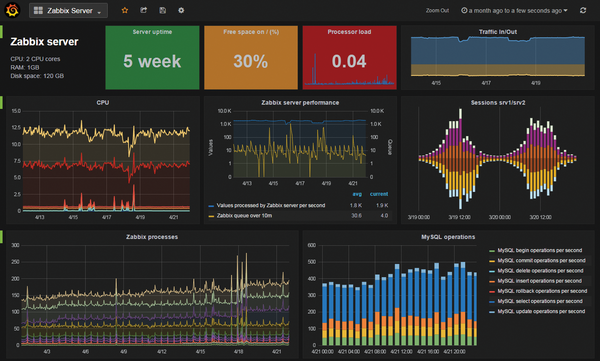 Figure 3: Grafana lets you compose dashboards to suit your needs.
Buy this article as PDF
(incl. VAT)
Buy ADMIN Magazine
US / Canada
UK / Australia
Related content
-
Grafana and Prometheus customized dashboards
 Grafana analytics and visualization dashboards plus the Prometheus monitoring and alerting tool make possible extensive custom reporting and alerting systems.
 -
Make better use of Prometheus with Grafana, Telegraf, and Alerta
 The Prometheus monitoring tool might not always look like one of the Titans, but add-ons like Alerta or Telegraf can improve its looks.
 -
Central logging for Kubernetes users
 Grafana's Loki is a good replacement candidate for the Elasticsearch, Logstash, and Kibana combination in Kubernetes environments.
 -
Monitoring containers
 A monitoring system helps avoid unpleasant surprises during operations, but admins need to modify existing solutions to fit a containerized world.
 -
Monitoring container clusters with Prometheus
 In native cloud environments, classic monitoring tools reach their limits when monitoring transient objects such as containers. Prometheus closes this gap, which Kubernetes complements, thanks to its conceptual similarity, simple structure, and far-reaching automation.
Subscribe to our ADMIN Newsletters
Subscribe to our Linux Newsletters
Find Linux and Open Source Jobs
Most Popular
Support Our Work
ADMIN content is made possible with support from readers like you. Please consider contributing when you've found an article to be beneficial.
