Hardware Stress Testing with Linux
Linux is a flexible and universal operating system because of many positive properties. One of its less well-known applications, however, is as a hardware diagnostics tool.
For functional and performance tests, many people still tend to rely on expensive special solutions running on other operating systems, but the small StressLinux Live distribution lets you test your system’s capabilities without the complex handling and high costs of other tools.
Based on openSUSE 11.4 and BusyBox, StressLinux is available as a 200MB, or 225MB ISO image for 64-bit and 32-bit architectures. Alternative versions are available for use with USB storage media or in a virtual machine. You can find easily understandable documentation for creating a bootable medium at the project website.
Blackbox
After launching, StressLinux initially comes up with an anachronistic text screen and rudimentary line graphics on a black background. Once the operating system is ready, you need to log in: The username and password are both stress . The routine then branches to the YaST2 configuration tool in text mode, which first customizes the keyboard, if needed, in the familiar blue window. The software prompts you to enter the motherboard. If you are not sure what board you have installed, or you use a laptop with a motherboard designed specifically for mobile use, simply press the OK button to enable the first list entry, Run_sensors-detect . Your hardware is then checked in several individual steps for the availability of various sensors. On completion, the system shows possible test and benchmark commands in a table, displays a prompt, and waits for your input (Figure 1).
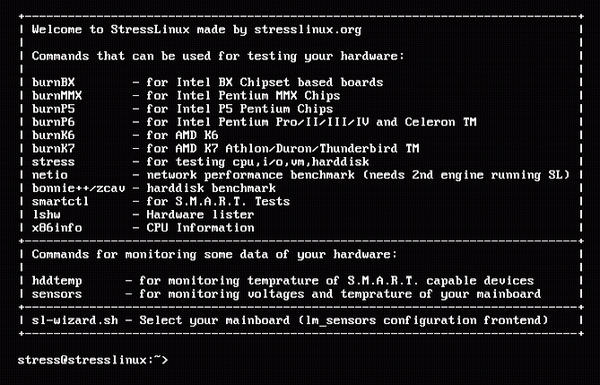 Figure 1: StressLinux offers a wide range of stress tests.
The top of the table displays an impressive number of test routines that are customized for specific hardware. These routines are sorted by manufacturers Intel and AMD. Below are programs that cover a wider range of tests, as well as tests that check network speed and mass memory. If you don’t know what hardware is installed in your system in detail, you can list the most important components by running the lshw command. The output from lshw is extensive, but you can page the output on screen with:
lshw | more
so you can view the details at your leisure. To determine the exact processor type, enter x86info at the prompt; this gives you the most important technical data for your CPU (Figure 2).
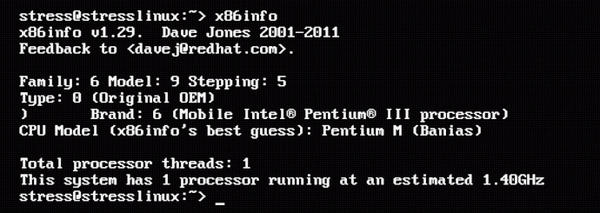 Figure 2: Short and to the point: CPU specs.
CPU and Chipset Testing
The first six programs in the list are available in some software repositories as part of the cpuburn suite. These programs test processors and chipsets from Intel and AMD – including the legacy K6 and K7 series, as well as modern compatible systems – at the highest possible load, allowing you to determine the extent to which a processor is suitable for overclocking and helping you home in on hardware problems. For example, a system under full load that switches off after a few minutes could indicate defective or insufficient CPU cooling.
You can start the test program in each case by running the console command specified in the list; this does not require administrative privileges. Because the programs do not usually output anything on screen, you should run your hardware tests in the background, so you can work at the console while the application is running. To test your state-of-the-art Intel CPU extensively, type in the command sequence
burnP6 || echo $? &
at the console. The CPU is fully loaded, so if you now run the top command on the console to display percent system utilization by various processes, burnP6 will always appear at the top of the list with a permanent CPU load of well over 95%.
StressLinux monitors the thermal performance of your system under load almost in real time, showing the relevant information with F10 through F12 key combinations.
The keyboard shortcut Ctrl+Alt+F12 takes you to the current temperature display for all sensors found on the system and displays fan speeds. Nearby is the CPU temperature display, which also indicates the maximum permissible operating temperature. If the display shows a sharp sensor temperature rise after a short time, and a higher fan speed does not have any influence on the heat development recorded by the sensors, it is best to check the cooling system. This is especially true for CPU cooling, in that thermal paste that dries over time directly on the processor can act as an insulator, ultimately resulting in damage to the system.
The keyboard shortcut Ctrl+Alt+F11 displays the current storage device temperatures. Under full load, and even after prolonged exposure to the stress test, the hard disk operating temperature should not rise above 50C; otherwise, you could experience data loss and damage.
Pressing Ctrl+Alt+F10 takes you to a graphically enhanced display of your network throughput; only the eth0 interface is monitored. This display remains inactive for CPU and chipset tests.
System Test
Typing the stress command launches a more comprehensive system test; in addition to the CPU, it checks the memory interface, memory, and, if necessary, storage devices. Because this test suite has an impressive number of parameters with which the individual routines can be adjusted, you should first run stress --help to get an overview of the possible options. To automate tests without overloading the system with too long a run time, you can set a time limit for the stress test run.
Storage
As hard disks grow older, they often become the weak component of a system; loss of data from a technical defect can have fatal consequences. StressLinux checks the health of your hard disks with two tools, bonnie++ and smartctl . Whereas Bonnie++ is a tool for benchmarking storage media, Smartctl supports test runs and shows the current technical condition of the hard drive. To start this useful tool, you must be the StressLinux root user or equivalent. The su - command gives you root privileges after entering the root password, stresslinux .
If you run the
smartctl -a <drivename> | more
command and see some data in the error log, you should back up at least your most important files. If you want to perform some additional test runs, typing smartctl --help will list the extensive set of parameters along with a few examples (Figure 3).
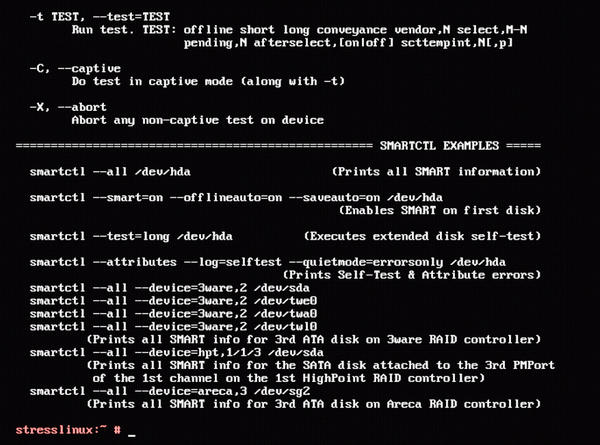 Figure 3: Smartctl can squeeze out all the details about your storage devices.
Network
To measure the throughput of your network interface, StressLinux provides the netio program, which measures data transfer between two computers, with one computer acting as the server.
After launching StressLinux on both machines in Live mode, you can launch the program on the server with the command
netio -s
and on the client by entering:
netio <server IP address>
StressLinux shows you the data throughput in list form with different packet sizes. Alternatively, you can display a bar graph of the transfer speed with Ctrl+Alt+F10.
Conclusions
StressLinux is a useful tool that can thoroughly put your hardware through its paces. The software does not dazzle with elaborate graphical gimmicks but does expect the user to have some knowledge of the command line.
As a Live “mini-distribution,” StressLinux will help you locate possible sources of errors and bottlenecks quickly and reliably, without the need for a time-consuming installation on the hard drive. In particular, StressLinux proves to be an excellent tool if you want to troubleshoot problems with the processor or cooling system. Of course, you need to keep an eye on the thermal performance of your system under load to prevent damage from overheating in the event of insufficient cooling capacity.
For serious PC users and IT engineers, StressLinux is an indispensable tool for diagnosing hardware problems and therefore belongs in every well-stocked toolbox.
Related content
-
Creating load for fun and profit
 Standard loads are essential to benchmarking.
 -
Finding Your Way Around a GPU-Accelerated Cloud Environment
 We look at the tools needed to discover, configure, and monitor an accelerated cloud instance, employing the simplest possible tool to get the job done.
 -
Load testing with Locust
 The Locust load test tool assesses the resiliency of your infrastructure to help you determine whether it can withstand a flood of requests.
 -
Load test your website with Siege
 A stress and benchmarking tool for websites controlled from the command line.
 -
Logical Bombs for Fun and Benchmarking
 The admin can generate load a number of ways with shell commands.
Subscribe to our ADMIN Newsletters
Subscribe to our Linux Newsletters
Find Linux and Open Source Jobs
Most Popular
Support Our Work
ADMIN content is made possible with support from readers like you. Please consider contributing when you've found an article to be beneficial.
