
Lead Image © Lucy Baldwin, 123RF.com
Network performance in-terminal graphics tools
Line Chatter
Jeff Layton regaled readers of the last issue with a survey of Terminal User Interfaces (TUIs) [1], a term describing tools sporting in-terminal graphics powered by the curses library [2] or one of its modernized variations, ncurses [3] or Newt [4]. Expanding Jeff's excellent treatment of the topic of writing TUIs, this month I will take you on a tour of the array of visual tools available to monitor your network connections. The whirlwind tour of available tools takes place on Ubuntu 18.04 (Bionic), out of convenience for the sheer number of packages available. You can install all of the commands demonstrated in this issue directly from apt; no compiling is necessary.
First Things First
A low-key and charming starting point comes in the form of the vnstat command [5], which in live mode (-l) starts off with a continuously updating single line providing network traffic statistics for the monitored interface:
$ vnstat -l
Monitoring eth0...  (press CTRL-C to stop)
   rx:      108 kbit/s    19 p/s          tx:       20 kbit/s    19 p/s
Things get more interesting when you hit Ctrl+C to exit and are treated to a summary of network statistics (Figure 1). Whereas this summary spans only the current execution interval, vnStat can just as easily provide traffic statistics on a daily basis for up to the last 30 days with the -d option (Figure 2). vnStat will even try to extrapolate traffic estimates for the remainder of the current month, if asked – try invoking the command with no options to see an example. One more interesting twist is provided by its companion tool vnstati [6]. The command
vnstati -s -i eth0 -o /tmp/vnstat.png
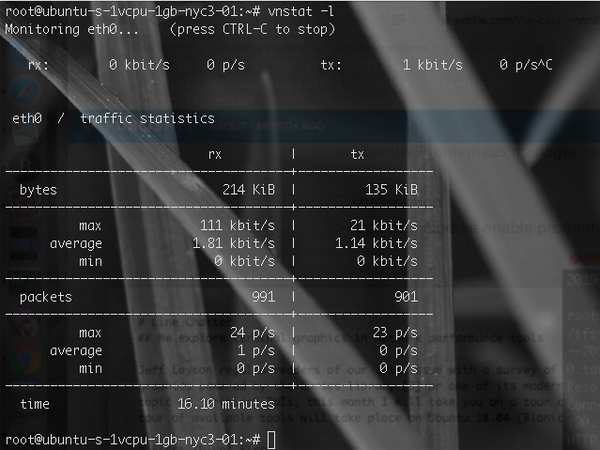 Figure 1: The vnStat renders in PNG format the statistics stored in vnStatd's database.
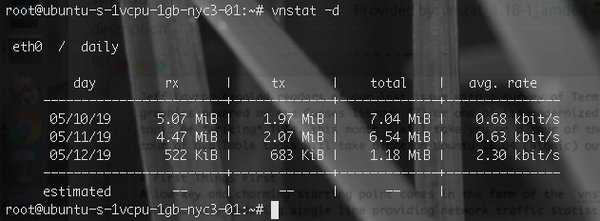 Figure 2: Traffic stats are available for the last 30 days in vnStat's database.
produces an equivalent graphical rendition of the content of vnstatd's [7] database (Figure 3).
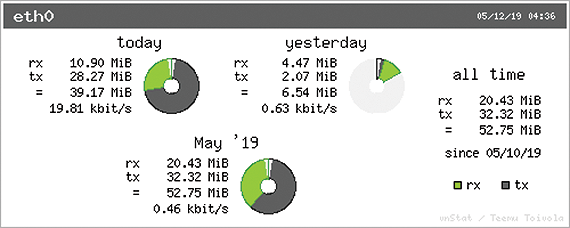 Figure 3: The vnstati utility renders in PNG format the statistics stored in the vnstatd database.
Undisputed Classics
The always popular iftop [8] lays a ranked view of each process's network traffic over a bar chart depiction comparing their relative sizes (Figure 4). Written in libpcap and ncurses, iftop is a likely contender for the title of tool everyone turns to for a first look at the network's state. With its reliable and intuitive visualization, it is a great starting point, and its text-only mode (-t) can be used to parse information, so that scripts can digest it more readily.
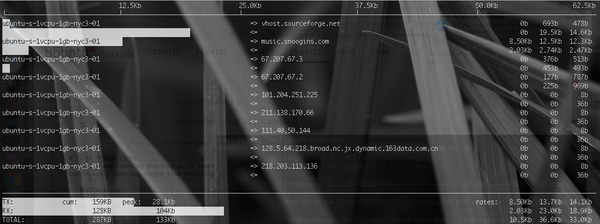 Figure 4: Often the first tool operators use to examine the state of the network is iftop.
A different kind of status overview is provided by the handy netwatch [9]. Tracking individual packets seen by an Ethernet interface, Netwatch tallies the totals according to source and destination addresses, effectively tracking the traffic on each connection visible to the host running the program.
Figure 5 effectively makes the case that the tool should always be invoked in top mode (with the -t switch) by showing the high noise level of the unranked view. Every connection in this figure shows fewer than four packets of traffic observed, while a concurrent connection exchanging thousands of packets was off the screen.
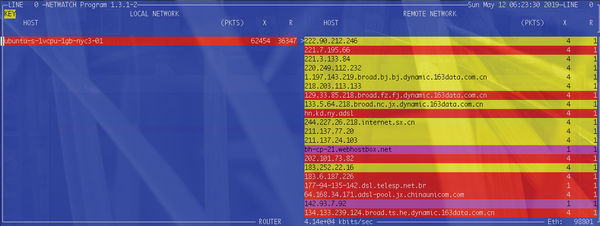 Figure 5: Netwatch counts the packets of each active connection but does not rank the list unless asked to (-t).
NetHogs [10] performs a role similar to netwatch but accomplishes this in a slightly different style by ranking traffic as generated by local processes, grouping bandwidth use by PID instead of port number (Figure 6). NetHogs is very lightweight and does not rely on a dedicated kernel module. Just like top, it allows users to customize display properties dynamically (use s
and r
to switch sorting order between sent and received traffic).
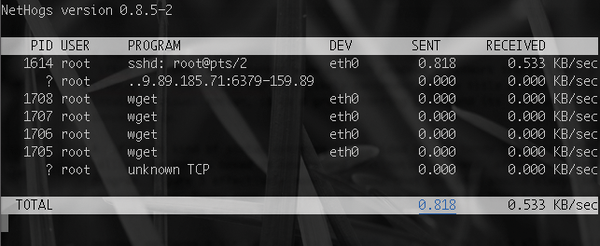 Figure 6: NetHogs immediately shows which process ID is responsible for all the traffic.
The ethstats tool [11] delivers the status of an interface in a single line of output, making it a perfect data source for scripts. For example, the line
$ ethstats -c1
   eth0:     0.03 Mb/s In    0.14 Mb/s Out -    51.4 p/s In     38.8 p/s Out
requests a single sample and shows a somewhat idle system.
Grand Finale
With a nearly inexhaustible supply of tools, my space for this month is running out, so I will focus on three more: ifstatus, slurm, and speedometer. IFStatus [12] is the latest in a number of implementations of the same concept, most notable among those being slurm [13] (Figure 7). Slurm is a simple and extremely lightweight way to check that the network has a heartbeat, finding a place among the multitude of permanently open terminal windows of many operators. A modernized version of the same plot with ifstatus resizes beyond 80 columns of width and uses actual terminal graphics instead of single 'x' characters to plot charts (Figure 7).
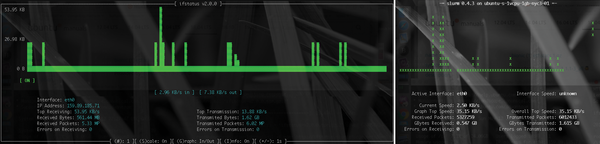 Figure 7: IFstatus (left) has slightly more detailed graphics than Slurm (right), which is an absolute classic in terminal interface minimalism.
Speedometer [14] provides a great view of network traffic on a host while sporting a handsome design (Figure 8). Additionally, speedometer can be used to monitor the speed of a file transfer by selecting the -f tap option instead of the network-based -tx or -rx defaults. With its multiuse abilities and UTF-8 smooth graphics, speedometer is an absolute winner.
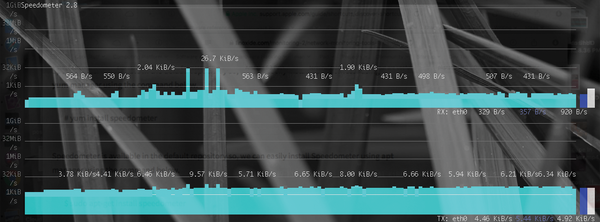 Figure 8: Speedometer delivers higher resolution than most TUI tools by using UTF-8 characters to plot graphics.
Infos
- "TUIs" by Jeff Layton, ADMIN , issue 50, 2019, pg. 40, http://www.admin-magazine.com/HPC/Articles/GUI-or-Text-Based-Interface
- curses: https://en.wikipedia.org/wiki/Curses_(programming_library)
- ncurses: https://en.wikipedia.org/wiki/Ncurses
- Newt: https://en.wikipedia.org/wiki/Newt_(programming_library)
- vnstat(6): https://manpages.ubuntu.com/manpages/bionic/en/man1/vnstat.1.html
- vnstati(1): https://manpages.ubuntu.com/manpages/bionic/en/man1/vnstati.1.html
- vnstatd(1): https://manpages.ubuntu.com/manpages/bionic/en/man1/vnstatd.1.html
- iftop(8): https://manpages.ubuntu.com/manpages/bionic/en/man8/iftop.8.html
- netwatch(1): https://manpages.ubuntu.com/manpages/bionic/en/man1/netwatch.1.html
- nethogs(8): https://manpages.ubuntu.com/manpages/bionic/en/man8/nethogs.8.html
- ethstats(1): https://manpages.ubuntu.com/manpages/bionic/en/man1/ethstats.1.html
- ifstatus(8): https://manpages.ubuntu.com/manpages/bionic/en/man8/ifstatus.8.html
- slurm(1): https://manpages.ubuntu.com/manpages/bionic/en/man1/slurm.1.html
- speedometer(1): https://manpages.ubuntu.com/manpages/bionic/en/man1/speedometer.1.html
Buy this article as PDF
(incl. VAT)
Buy ADMIN Magazine
US / Canada
UK / Australia
Related content
-
Finding Your Way Around a GPU-Accelerated Cloud Environment
 We look at the tools needed to discover, configure, and monitor an accelerated cloud instance, employing the simplest possible tool to get the job done.
 -
Logical Bombs for Fun and Benchmarking
 The admin can generate load a number of ways with shell commands.
 -
Ubuntu Server 18.04 "Bionic Beaver" LTS
 Ubuntu Server 18.04 "Bionic Beaver" LTS
 -
Favorite benchmarking tools
 We take a look at three benchmarking tool favorites: time, hyperfine, and bench.
 -
Thrashing the data cache for fun and profit
 To reduce the possibility of disk thrashing, optimize your data cache through spatial locality and cache-friendly algorithms and utilize fully the data loaded from slower storage media before moving on.
Subscribe to our ADMIN Newsletters
Subscribe to our Linux Newsletters
Find Linux and Open Source Jobs
Most Popular
Support Our Work
ADMIN content is made possible with support from readers like you. Please consider contributing when you've found an article to be beneficial.
