« Previous 1 2
Top Top-Like Tools
The Tops
psutil: Create Your Own Top
DevOps [10] is a term used to describe what most admins have been doing for years – writing code in addition to administering their systems. Python [11] is one of the most popular languages used for DevOps. People have been developing Python modules (libraries) for applications and monitoring systems that have proven to be very useful, and one fantastic library is psutil [12].
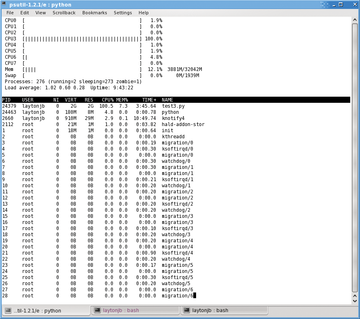
Psutil is a cross-platform library for gathering information on running processes and system utilization. According to the website, it currently supports Linux, Windows, OS X, FreeBSD, and Solaris. It has a very easy-to-use set of functions and can be used to write all sorts of useful tools. In fact, the author of psutil wrote a Top-like tool [13] in a couple of hundred lines of Python, which I'll refer to it as ptop, even though the author calls it just top.py. I'll briefly talk about this code as an example of what you can accomplish if you want to roll your own Top tool. That in itself is worth a mention.
Ptop (Figure 12) doesn't really do anything beyond the classic Top tool, but because the code is simple, it is fairly easy to modify to implement your own features and capabilities. If you compare Figure 12 with Figures 1 (Top) and 7 (htop), you can see that the simple Python code creates output that is very close to both, particularly htop. The code has no real options, but, again, you can customize it to your needs.
vtop
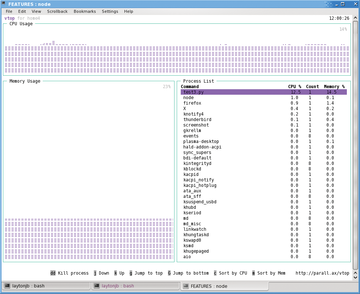
Finally, one more Top-like tool that I just learned about is the new and innovative vtop [14]. I think of it as a real-time ASCII charting tool for node performance. GUI tools such as Ganglia provide good charts of node performance, but what happens when you just have an SSH login to the node? A real-time chart might be nice to help you see what's happening on the node.
This is where vtop comes in. Vtop creates two ASCII charts at the top and bottom of the output. The top chart shows the overall CPU activity as a percentage of the total. The bottom left chart shows the memory usage as a percentage of the total. At the bottom right, a window lists the top processes sorted by CPU percentage.
Vtop uses Node.js [15] as its basis, so you need to install that first. After Node.js is installed, just run the following command as root and vtop is installed for you:
npm install -g vtop
On my CentOS 6.5 system, it was installed as /usr/bin/vtop, which makes it very easy to run. Figure 13 shows a screen capture of vtop when running the sample Python code.
Vtop has some interactive capability, as you can see at the bottom of the screen, but to be honest, I've just started working with vtop, so I don't have much experience with it yet. I find the beautiful ASCII real-time graphs to be very useful in understanding what's going on with CPU usage and memory usage.
Be sure to test vtop on the terminals you use. In a fit of nostalgia, I tried it on rxvt [16], and it didn't work too well, but I hope to use vtop more in the future.
Summary
If you're going to answer the call when things go wrong, you need tools to solve problems. Without knowing what is causing the problem or even what the problem is (e.g., "my application is running slow"), the first tool I reach for is Top.
Top gives me a quick snapshot of what is happening on the server, and because it's ASCII based, I can pretty much run it on any server, as long as I can get a shell, SSH, or even a crash cart to the server.
Using Top, I can see running tasks or processes, what is happening on the processors, and memory usage (although that is not always easy to understand with Linux). Sometimes, however, Top didn't give me all the information I wanted, so I started learning about and using other Top-like tools.
In this article, I covered a few tools that you might find useful. In addition to Top, I talked about htop, atop, ptop (roll your own top tool), and vtop. To be honest I use top, htop, and atop quite often, usually in that order, but I might take DevOps to heart and use ptop to create my own Top-like tool someday. The last tool, vtop, is new and creative and shows a great deal of promise for examining real-time ASCII charts. I'm really excited to learn more about vtop and how I can use it.
Infos
- Ganglia: http://ganglia.sourceforge.net/
- nice: http://en.wikipedia.org/wiki/Nice_%28Unix%29
- PID: http://en.wikipedia.org/wiki/Process_identifier
- htop: http://hisham.hm/htop/
- ncurses: http://en.wikipedia.org/wiki/Ncurses
- htop/Top comparison: http://hisham.hm/htop/index.php?page=comparison
- atop: http://www.atoptool.nl/
- atop man page: http://linux.die.net/man/1/atop
- atop screenshots: http://www.atoptool.nl/screenshots.php
- DevOps: http://en.wikipedia.org/wiki/DevOps
- Python: https://www.python.org/
- psutil: https://github.com/giampaolo/psutil
- Python Top clone: https://github.com/giampaolo/psutil/blob/master/examples/top.py
- vtop: http://parall.ax/vtop
- Node.js: http://nodejs.org/<
- rxvt: http://rxvt.sourceforge.net/
« Previous 1 2
Buy this article as PDF
(incl. VAT)


