Service mesh for Kubernetes microservices
Mesh Design
Check the Application
The acceptance test is simple: Browse to the configured hostname and check that a functioning WordPress site with a valid SSL certificate is available. For this demo, I downloaded a selection of public domain artwork related to ships and created a gallery of nautical artwork with a valid SSL certificate (Figure 9).
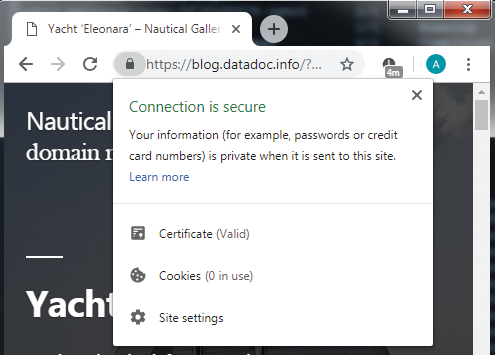 Figure 9: The working WordPress site.
Distributed Tracing with Jaeger
Istio's telemetry functions are broadly divided into tracing (to see how individual requests behave) and metrics (statistics based on the outcomes of a large number of requests). Istio 1.1 introduced default metrics for TCP connections between services, in addition to the metrics for HTTP and gRPC communication that were generated by previous versions. This new default is useful here, because the requests from the WordPress apps to the MySQL database do not use HTTP. For more interesting traces, I created another simple service that would generate a Hello World-type message string in response to a curl request made by a WordPress plugin, to create internal HTTP traffic.
Istio generates tracing information by correlating spans
together, a span being a request from one service to another. The sidecar proxies send the details of each span to Istio Mixer, which relies on HTTP header information, propagated from one span to another, to create a trace from related spans. The results of this can be viewed in the Jaeger app that's bundled with the Istio demo deployments. To access this, set up a port forward for Jaeger from kubectl on your local machine:
kubectl port-forward -n istio-system $(kubectl get pod -n istio-system -l app=jaeger -o jsonpath='{.items[0].metadata.name}') 16686:16686 &Next, browse to localhost:16686 to access the Jaeger dashboard, and apply the service and time-based filters on the left-hand side to see spans of interest. Figure 10 shows a trace in which the WordPress service accesses the message-provider service, along with timing and response information for each.
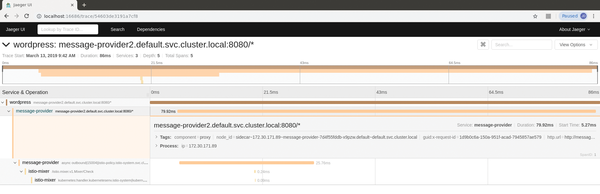 Figure 10: Tracing a request span with Jaeger.
Viewing Metrics in Grafana
Grafana is an open source suite of tools for producing (primarily) time-based graphs, which lends itself to producing visualizations of all sorts of services. It is the default front end for Istio's telemetry system. The Grafana app that ships with Istio has a selection of preconfigured dashboards and common metrics that are generated automatically for each service in the application – all you need to do is make sure your Kubernetes services and deployments have named ports in their configurations; otherwise, Istio might not collect metrics. Because the demo website is publicly accessible, it's easy to generate some load with external tools for interesting graphs. I ran curl commands within loops in a Bash script to load up the website and then watched what was going on via the mesh and service dashboard graphs, which auto-update every few seconds.
To connect to the Grafana dashboards for your Istio service mesh, use the kubectl port forwarding service, so you can tunnel localhost requests to the Grafana service running in your istio-system
namespace:
$ kubectl -n istio-system port-forward $(kubectl -n istio-system get pod -l app=grafana -o jsonpath= '{.items[0].metadata.name}') 3000:3000 &Now, start a browser and point it at localhost:3000
. The various dashboards, metrics, and display options are easy to navigate. In the routing rules for the VirtualService configured in Listing 3, a 90:10 split (lines 34 and 38) between the production and prerelease versions of the WordPress deployment was specified, and that is roughly reflected in the ops rates shown in the Requests
column (Figure 11) for the two WordPress services – 1.49 and 0.11 ops, respectively, for the loading script I used. Selecting any of the services from the list on the main Mesh Dashboard page gives you a more detailed insight into the metrics for that service.
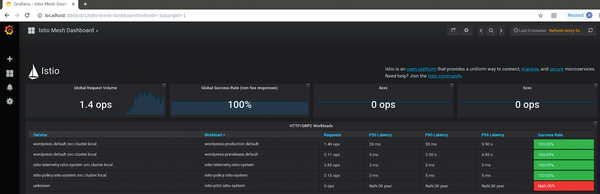 Figure 11: The Istio Mesh Dashboard in Grafana shows that the request rate to the production WordPress service is (approximately) 10 times the rate to the prerelease service, in line with the routing rule weightings.
Buy this article as PDF
(incl. VAT)
Buy ADMIN Magazine
US / Canada
UK / Australia
Related content
-
A service mesh for microarchitecture components
 Istio facilitates communication between the many small microcomponents that need to communicate with each other in modern applications.
 -
Cloud Foundry realizes a service mesh
 Cloud Foundry deployments that use a service mesh routing plane have access to weighted routing, which lets you control the amount of traffic sent to each route.
 -
Managing network connections in container environments
 Traefik promises not only to manage mesh implementations for container environments reliably, but to do so in a way that makes them enjoyable to administer.
 -
A versatile proxy for microservice architectures
 The nimble Envoy proxy server addresses modern container environments, but does it outperform its rival Istio, which has Envoy at its core?
 -
Tracking down problems with Jaeger
 The various components of cloud-native applications are always exchanging information, which makes troubleshooting difficult. The Jaeger tracing framework helps hunt down the perpetrators.
Subscribe to our ADMIN Newsletters
Subscribe to our Linux Newsletters
Find Linux and Open Source Jobs
Most Popular
Support Our Work
ADMIN content is made possible with support from readers like you. Please consider contributing when you've found an article to be beneficial.
