« Previous 1 2 3 Next »
Monitor your network
Pandora's Box
Get Onboard
Once you have installed the agents on all your machines, it's time to fire up the Pandora FMS dashboard. Launch a web browser on any computer in the network and head to http://192.168.0.11/pandora_console (replacing the IP address with the address of the machine where you've installed Pandora FMS). The first time you launch it, the dashboard will perform some housekeeping tasks, such as installing the database schema (Figure 1). When it's done, you can use admin:pandora as the default login credentials.
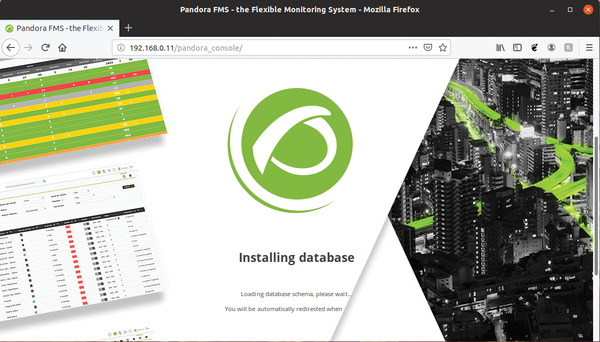 Figure 1: On first launch, the dashboard will take you through a small configuration wizard to select the language, time zone, and subscription to the update manager service.
The Pandora FMS default landing page (Figure 2) gives you an overview of the Pandora FMS server's condition, as well as the condition of other machines on your network, along with a list of recent activity.
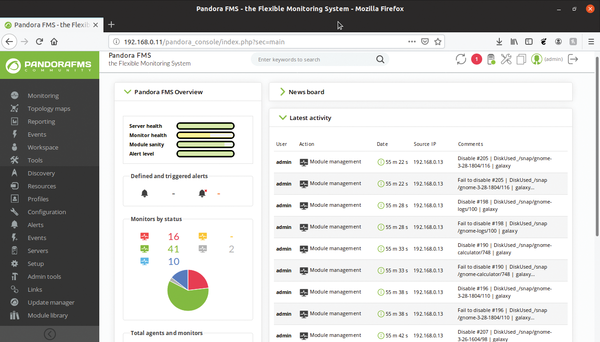 Figure 2: The dashboard has a customizable news board that you can use to share important information with other admins.
The dashboard is divided into three sections. On top is the header that gives you quick access to some of the monitoring server's important features. A prominent part of the header is the search bar that allows you to quickly navigate to various parts of the monitoring server, such as reports, graphs, alerts, users, and more.
If there are any pending system notifications, an alert icon will be displayed in the header. You can click on the icon to view the details about the alerts and take remedial actions. The header also has several links, including a link that shows the Pandora FMS server's status, a link to the online support forums, and another to the project's official documentation.
The most important component of the dashboard is the navigation menu on the left side of the interface, which is divided into two sections. The top six entries make up the operations menu, while the rest are part of the administration menu.
As the name suggests, you can use the operations menu to take stock of the computers that are being monitored by Pandora FMS. The administration menu lets you configure and tweak the different aspects of the monitoring server as per your needs and requirements. For instance, you can view and configure the checks carried out by the individual agents and alter their modules' behavior. Virtually all the entries in both navigation menus have submenus to help you drill down to the exact setting.
Active Agents
Since you've already added agents, your Pandora FMS server should have begun monitoring them. Log into the web dashboard and head to Resources | Manage agents to list all the agents currently being tracked by the Pandora FMS server.
Mouse over an agent in the list to reveal several links (Figure 3). The Edit link will help you tweak the basic details about the computer that was configured automatically by the agent you installed on the machine. Starting with Pandora FMS v7, all agents have an agent name, which acts as a unique identifier and an alias. By default, the agent gets the machine's hostname as the alias and a very large random hexadecimal number as a name or identifier (Figure 4).
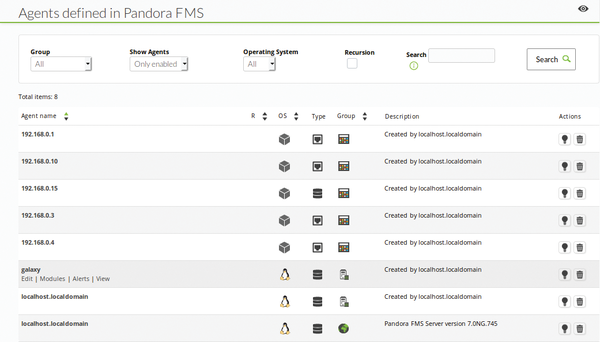 Figure 3: You can filter the list of agents by several parameters and even disable or delete them.
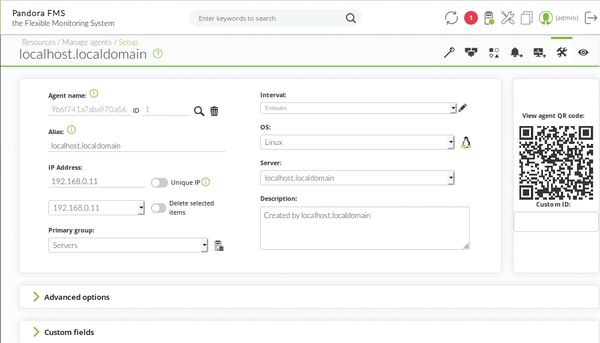 Figure 4: You can define various identifying information, such as a device's serial number or the department a computer belongs to, using the Custom fields section.
The View link will fetch the monitoring details from that particular computer, such as CPU usage, free memory or disk space, and more (Figure 5). Each piece of this information corresponds to a module. You can add or delete modules to an agent as needed.
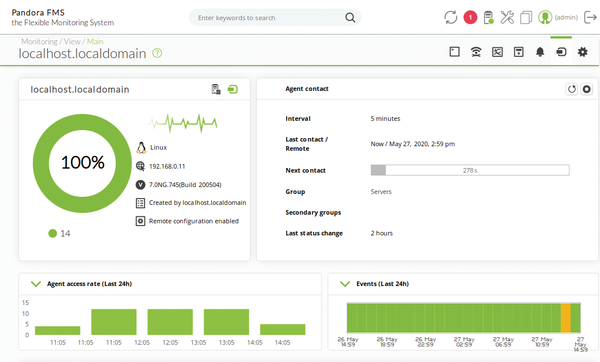 Figure 5: You can use the icons in the Agent contact section to fetch the data from the agent. immediately without waiting for the specified interval.
When viewing an agent, you get several icons in the top-right corner. There's an icon that'll help you edit the agent details including adding or removing modules. Also useful is the graphs icon that lets you graphically chart the values of the various monitored parameters (Figure 6).
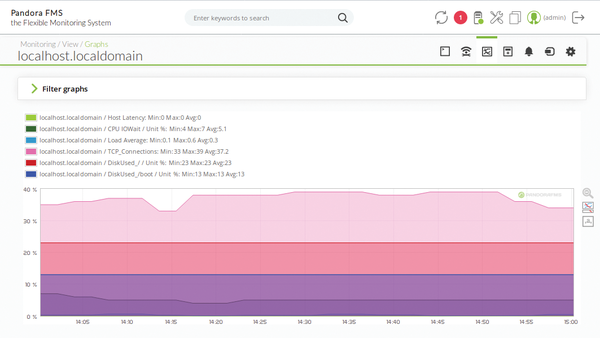 Figure 6: You can pool multiple monitors in one graph or view them separately; you can even export the data as a CSV file.
Keep Tabs
Since the Pandora FMS server is already receiving monitoring data, you should be able to see an overview of the agents on the landing page of the dashboard itself.
The Total agents and monitors section lists the total number of agents and the monitors or resources that are being monitored. Under the Monitors by status section, you'll be able to see a break down of these resources under different color-coded states. For instance, the resources that need your immediate attention are red, while the ones that are operating within the defined limits are green. Mouse over each monitor to get an explanation about the state each color code represents.
You can jump right in and click on the number of critical monitors to get a detailed list of all the resources that require your immediate attention. You'll be shown various details for all the monitors that are in critical state, such as the name of the module and the agent or the computer to which it belongs (Figure 7). You can also use the buttons under the Graph column to chart the monitor's history in order to determine when it went critical. Each entry also has an edit button to help you tweak the values for the monitor in case you determine the default values are too low for your liking.
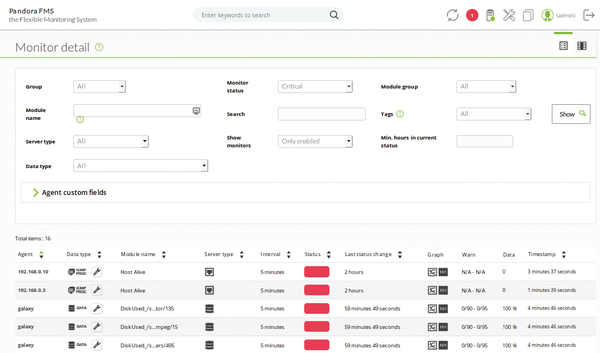 Figure 7: It's always a good idea to review the default thresholds for all the monitors and tweak them to meet your requirements.
« Previous 1 2 3 Next »
Buy this article as PDF
(incl. VAT)
Buy ADMIN Magazine
US / Canada
UK / Australia
Related content
-
Monitor Windows systems and Linux servers
 The Microsoft Operations Management Suite provides a comprehensive monitoring solution in the cloud that offers a high degree of flexibility and scalability.
 -
Migrating to Azure Monitor Agent
 The replacement for the Log Analytics Agent has improved security and cost efficiency, better manageability, and greater reliability – and you must migrate to this new solution by the end of 2024.
 -
Mobile PC Monitor
Monitoring your internal server environment just became easier with MMSOFT Design’s Mobile PC Monitor software.
-
Monitor Active Directory with Azure AD Connect Health
 Microsoft cloud service Azure Active Directory Connect Health supports monitoring of Active Directory, especially in large and distributed environments, but the tool is also useful for monitoring hybrid landscapes using Azure Active Directory.
 -
Total Network Monitor
Even Windows doesn’t have to have an expensive network monitoring tool. The free Total Network Monitor helps you keep an eye on your network.
Subscribe to our ADMIN Newsletters
Subscribe to our Linux Newsletters
Find Linux and Open Source Jobs
Most Popular
Support Our Work
ADMIN content is made possible with support from readers like you. Please consider contributing when you've found an article to be beneficial.
