File access optimization discovery and visualization
Fast and Lean
Optimizations Overview
The first section of the dashboard provides an overview of the number and locations of potential optimizations. Vertical bar chart panels visualize their number. The first shows all files used by the program and compares the possible optimizations in each file (Figure 10).
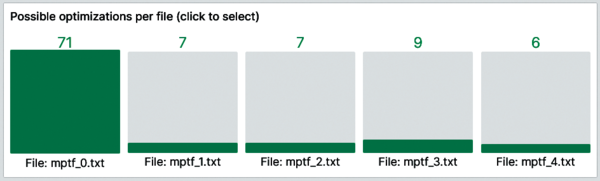 Figure 10: Bar chart displaying number of optimizations found in each file.
Clicking on any bar automatically selects the clicked file as the value of the corresponding dashboard variable. Data links within the panel enable this type of interaction. These links seamlessly change the desired variables by redirecting to a URL in the same tab, which sets variables according to the clicked field label value:
http://localhost:3000/d/<id>/file-access-analysis?orgId=1&${__url_time_range}&${bucket:queryparam}&${measurement:queryparam}&var-filename=${__field.labels.traced_filename}With the selected file automatically set as the variable value, the adjacent bar chart panel displays the number of possible optimizations for all file accesses on this file (Figure 11). This panel is also interactive, so you can select the desired file access by its ID, which automatically updates the corresponding dashboard variable.
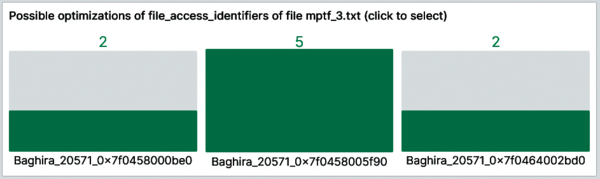 Figure 11: Bar chart displaying the number of optimizations found for each file access of a selected file.
The bar charts serve to inform you about the parts of the program that have the highest potential for optimization. Furthermore, these panels provide an easy and interactive way to select the content to view.
Optimization Details
With the file access for investigation selected, the next panels visualize additional information about the file access and its potential optimizations.
The time series panel at the top in Figure 12 shows the detailed course of the file access cursor, along with the calculated offsets. The colors of the points are mapped to the called functions and highlight the consecutive repeated function calls as potential optimization points by automatically connecting the same-colored points.
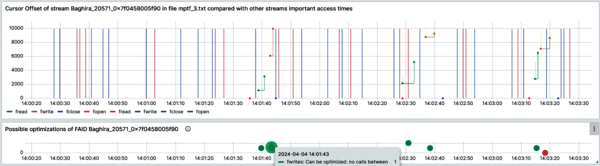 Figure 12: Time series panel (top) with calculated optimization points (bottom).
In addition to the cursor offset of the selected file access, the time series panel displays the function calls of all other file accesses on the same file. To determine whether calls occur between repeating functions, the diagram only shows the times and kinds of functions.
Vertical colored lines indicate the timestamps of the function calls of other file accesses. If a different function call falls between consecutive repeated functions connected by a line, the vertical line visibly crosses the horizontal line, which indicates the potential for optimization where an intermediate function must be considered.
This panel can help you identify where the potential optimizations lie inside the program's code. The analysis of potential optimizations happens inside the script and is displayed in the panel beneath the time series panel.
The optimization diagram in Figure 12 visualizes all optimization points, whether possible or not, and is aligned to the panel above, so you can see directly which optimization point corresponds to which repeated function calls. The color coding of the points indicate their classification. Points with the value and classification 0 cannot be optimized and appear in red.
The panel shows points with values 1 and 2 in green, indicating that the cases can be optimized. If a point has value 3 and contains a function that cannot be handled, it is orange. This color coding is realized with the Thresholds panel option (Figure 13). Mousing over these points reveals information that explains their classification (Figure 14).
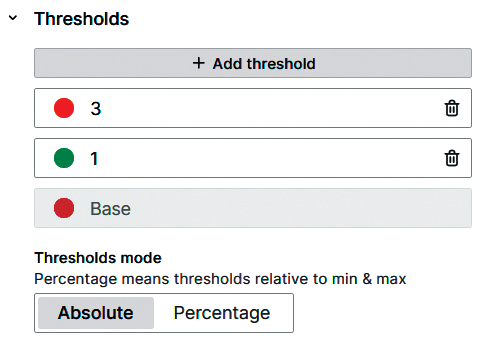 Figure 13: The panel option required for color coding optimization categories.
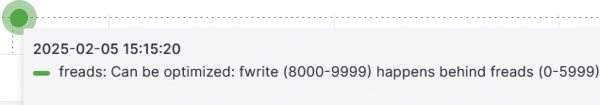 Figure 14: Information about the reason for the classification is displayed when mousing over an optimization point.
The retrieved data points have a specific structure, containing information added by the script as tags for each point:
{_start="<start-timestamp>", _stop="<stop-timestamp>", function="fread",info="Can be optimized: fwrite..."}To display only the relevant information on mouse-over, the panel transforms the data with the Rename by regex transformation, extracting only the values of the required tags (Figure 15). In this way, you receive the desired information as needed and can see directly how many and where optimizations are possible.
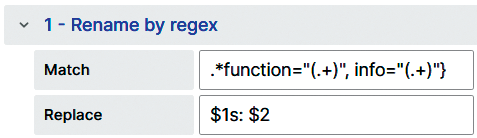 Figure 15: Option to rename points that display relevant information.
Insights Gained by the Tool
Too many small I/O function calls add unnecessary overhead. In summary, the pipeline works as follows: Monitor and trace a program during runtime with libiotrace , run the Python script working with the created data, and receive the desired insights in the Grafana dashboard. The dashboard explains the optimization possibilities, giving additional information that helps you understand each case. Applying those optimizations causes more efficient file access patterns in the program and thus higher performance, running quicker and using fewer resources.
To prove that this work can improve a program's efficiency, we created a small program in C simple enough to repeat that simulated several file accesses with fwrite, fread, and fseek function calls. By running the compiled program with active libiotrace
measurements and by using the script presented here, we could view the optimization analysis in the Grafana dashboard. The execution time of the program was also measured.
After optimizing the script with the help of the dashboard suggestions and executing the program again, we saw that it performed drastically fewer function calls because calls were merged when possible.
When comparing the mean execution times of 10 program executions of the optimized and unoptimized versions, a 4.15 percent improvement in overall time was observed. The tested program's execution time was a little more than three seconds.
Applying this method to much bigger programs can lead to much greater improvements, affecting not only time consumption, but also resource and energy usage in the long term.
Infos
- Darshan: https://www.mcs.anl.gov/research/projects/darshan/
- Vampir: https://vampir.eu/
- libiotrace: https://github.com/hpcraink/fsprj2, https://www.admin-magazine.com/Archive/2022/71/A-ptrace-based-tracing-mechanism-for-syscalls
- POSIX: https://pubs.opengroup.org/onlinepubs/9699919799
- MPI: https://www.mpi-forum.org
- Script described in this article: https://linuxnewmedia.thegood.cloud/s/9nFQcFb2p8oRMEJ
- pandas.DataFrame: https://pandas.pydata.org/docs/reference/api/pandas.DataFrame.html
Buy this article as PDF
(incl. VAT)
Buy ADMIN Magazine
US / Canada
UK / Australia
Related content
-
A ptrace-based tracing mechanism for syscalls
 The libiotrace library monitors running, static and dynamically linked programs and collects detailed data for many file-I/O-related function calls.
 -
HPC Storage strace Snippet
strace snippet
-
HPC Storage strace Snippet
strace snippet
-
Appendix – I/O Report from MPI Strace Analyzer
Appendix – I/O Report from MPI Strace Analyzer
-
Appendix – I/O Report from MPI Strace Analyzer
Appendix – I/O Report from MPI Strace Analyzer