Figure 5
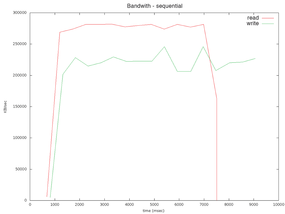
Figure 5: A small script creates plots from bandwidth or latency logs.
Figure 5: A small script creates plots from bandwidth or latency logs.