Figure 4
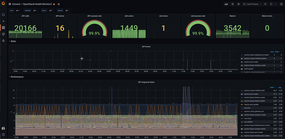
Figure 4: The Grafana dashboard of the OpenStack Health Monitor.
Figure 4: The Grafana dashboard of the OpenStack Health Monitor.