I/0 Workload fig02
«
Previous
|
Images
|
Next
»
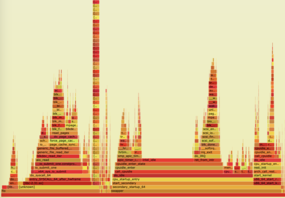
Figure 2: Flame graph: a visual representation of the perf data.
Powered by
eZ Publish™ CMS Open Source Web Content Management
. Copyright © 1999-2014
eZ Systems AS
(except where otherwise noted). All rights reserved.