Remora F08
«
Previous
|
Images
|
Next
»
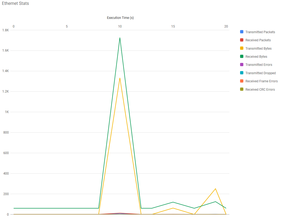
Figure 8: Example 2 Ethernet utilization plot.
Powered by
eZ Publish™ CMS Open Source Web Content Management
. Copyright © 1999-2014
eZ Systems AS
(except where otherwise noted). All rights reserved.