Figure 2
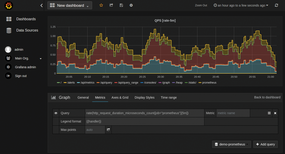
Figure 2: Grafana is the tool of choice for visualizing data, including percentiles.
Figure 2: Grafana is the tool of choice for visualizing data, including percentiles.