Figure 3
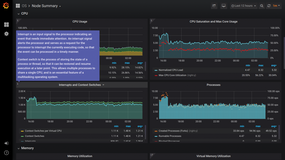
Figure 3: Mouse over the i button in the title of a graph to view information about how a particular metric is collected and what it signifies.
Figure 3: Mouse over the i button in the title of a graph to view information about how a particular metric is collected and what it signifies.