Wireshark
Troubleshoot network problems with this popular protocol analyzer.

Linux comes with a lot of useful network analysis tools, many of which provide excellent results that can easily compete with commercial tools. Despite this, Windows administrators are sometimes wary of deploying open source tools without a graphical user interface.
Basically, network analysis software does nothing but record all the traffic on the specified network interface. To allow this to happen, software continuously grabs all of the data packets and stores them on disk. Then, the software decodes the data and displays the results on screen.
Tcpdump is a classic tool in the Unix world and is widely used by experts. However, it only offers a command-line interface. Tcpdump is available for just about any Unix derivative, such as AIX, BSD, Solaris, and is nearly always included in the standard package sources of any version of Linux, if not installed by default. A port for Windows exists under the name of WinDump, based on WinPcap. Tcpdump needs direct access to the hardware and thus typically runs with root privileges. The exceptions are Mac OS X and Solaris, where the user only needs access privileges for the network interface card device file.
By default, Tcpdump reads all the data that reached the specified network card across the network and displays it, for example, on the standard output device, or stores it in files that the administrator can evaluate later. One particularly impressive thing about Tcpdump is its useful collection of filters. These capture filters are based on Libpcap, a C/C++ library that supports access to the network interface’s link layer. Administrators can control Tcpdump’s behavior at the command line by passing in parameters, including the filters to use.
Ethereal and Wireshark
Because a command-line interface isn’t everybody’s idea of user friendliness, graphical solutions that also rely on the Libpcap library have been around for some time. One of these tools is Wireshark, which dates back to 2006. It was formerly known as Ethereal and is probably known to many administrators by that name. The tool was renamed when version 0.99.1 of Wireshark was released, because Ethereal developer Gerald Combs left Ethereal Software. He launched a successor project under the name of Wireshark with CACE Technologies, and this prompted Ethereal Software to discontinue the development of the predecessor product.
Today, Wireshark is mainly developed by the Wireshark community. Ethereal and Wireshark are genuine open source projects, although Ethereal is oriented to network analysis products by commercial vendors. Development milestones for Wireshark include version 1.0, which became available in March 2008, and the bug fix version 1.4, which became available in the summer of 2008. Both of these versions offered experimental support for Python scripts and the ability to right-click the packet details in the packet list to add protocol fields.
The release of Libpcap 1.0.0 added the ability to define the buffer size for recording and to view JPG files directly in Wireshark. Version 1.6 of Wireshark (which prompted me to write this article) was released in July 2011 and offers better support for large files of more than 2GB. It can also import text dumps in a similar style to text2pcap. The developers have also made the GUI more user-friendly so that admins can hide columns while at the same time defining custom columns for the required fields.
The main feature of the new version is support for more than 30 new protocols including JSON, Wi-Fi P2P (Wi-Fi Direct), and Fibre Channel over InfiniBand. Also, Wireshark 1.6.0 can export SSL keys and SMB objects. Another new feature in Wireshark 1.6 is that the software displays VLAN tags (IEEE 802.1q) directly in the Ethernet II protocol tree.
Wireshark is licensed under the GPLv2 and can be installed using the package manager of just about any popular Linux distribution. However, Ubuntu Natty comes with Wireshark version 1.4.6. You can check out the download page for the source code of the current version for Unix systems and binary packages for Windows and (as of 1.6) Mac OS X. Installing the 32-bit Windows version is self-explanatory. You just need to download the archive and then double-click the installer file (wireshark‑win32‑1.6.1.exe). The Wireshark installation wizard also launches a helper for installing WinPcap, which needs to complete first.
Wireshark Basics
Before you start analyzing your network with Wireshark, it is always a good idea to do some planning. Of course, this approach applies to the use of any system tool, but, in the case of network analysis with gigabit Ethernet, you really do need to make sure that you have sufficient system resources. For this reason, administrators should have some idea of the volume of data to expect. This factor will depend on the kind of data traffic you want to capture and with what objective, which, in turn, will drive your choice of filters. You may also need to ensure that this doesn’t influence the measurement because it, for example, automatically discards some packets.
If you need to measure network data that is not intended for the host in which the network interface is configured, the Wireshark configuration dialog gives you the option of running the network device in promiscuous mode or non-promiscuous mode. In non-promiscuous mode, Wireshark will analyze only packets sent to or from its own host, and it will discard all other data packets (with external target addresses.)
In promiscuous mode, Wireshark can analyze any data packet from any machine that exists on the network because it will also accept data packets with external target addresses in this mode. If all of the resources on the network are connected by means of hubs, using promiscuous mode to read all of the data packets isn’t a problem, because hubs always send all data packets to all ports.
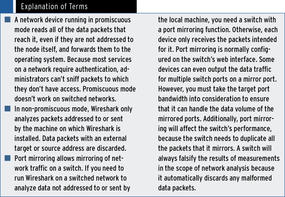
However, switches are very popular even on small networks, not to mention enterprise networks. The idea behind a switched network is to declutter the data traffic so that a node attached to a switch only receives data packets intended for it. Thus, it makes sense to use the port mirror function on a switched network to route the mirrored port data (for the node you want to analyze) to the network card in the local machine on which Wireshark is installed. For more details, see the “Explanation of Terms” box.
Getting Started
Before you run Wireshark for the first time, you need to configure it. In the Capture | Options menu, start by defining the network interface that Wireshark will use to capture data traffic in the list field top right (Figure 1). You can also click the Options button for a NIC in the Capture | Interfaces menu, which shows you all the network interface built into the client, to access this dialog.
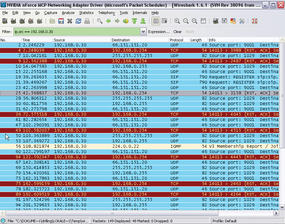
Figure 1: Before you start capturing packets, you first need to configure Wireshark in Capture | Options.
You can also define a number of other framework conditions in this dialog. For example, you can define your own filters in the field to the right of the Capture Filter button. The data volume you can expect will depend on how the host you want to analyze is connected to the Internet. You can use a filter to tell Wireshark to accept only Internet data traffic for this post or to restrict the protocols to ones that are actually related to the problem. If you don’t do this, you will first need to search for the relevant packets from a huge number of protocols or broadcasts.
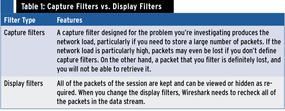
Wireshark uses two kinds of filters with different syntax (unfortunately): capture filters and display filters. Capture filters allow the administrator to tell Wireshark which packets to capture; they define the expected volume of data and are thus responsible for analyzing the existing databases. Based on the results of capture filtering, you can derive display filters for the type of analysis you want to perform. Capture filters use the Libpcap syntax. To filter for a specific MAC address, you would do the following in
Libpcap syntax:
ether host 00:25:4b:bd:24:94
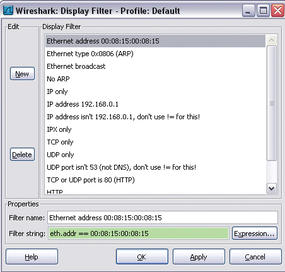
Figure 2: Wireshark includes a number of predefined display filters and supports interactive creation of display filters thanks to its filter toolbar.
However, if you want to restrict the display to this MAC address, the corresponding display filter syntax would be as follows:
eth.addr==00.25.4b.bd.24.94
That said, display filters are far more flexible. With display filters, you can include all supported packet types (Figure 2).
The decision to use capture filters or display filters depends on a number of factors. For an overview of the most important advantages and disadvantages, refer to Table 1.
Configuring Wireshark
To familiarize yourself with Wireshark, you might be interested in a bird’s-eye view of the network traffic that reaches the host in question. For this, you first need to close all known applications that regularly communicate on the network, such as your browser, email client, or messengers. After this, access the network interface card in the Capture | Options menu and, if needed, change the buffer size to suit your requirements. The selected buffer size also defines the number of packets at Wireshark can keep in memory before the program used to write data to your disk. A larger value is recommended in networks with an extremely high volume of data.
As described previously, the Capture packets in promiscuous mode option tells the interface to capture all incoming data traffic and pass data on to the operating system or processing. Normally, you don’t need to limit the packet size, so this option is not set by default. Because in this example, I want to analyze all data traffic, I will not apply a capture filter right now. You will probably also want to disable Update list of packets in real time in Display Options to avoid Wireshark using up more than its fair share of system resources.
Another important option is found at the bottom right in the Name Resolution area. If you select Enable Network Name Resolution, Wireshark will use DNS to convert all IP addresses into names, which can take some time. This explains why the option is disabled by default and why Enable MAC name resolution is enabled instead.
You can use the Capture Files(s) area to define how the capture data are stored. Normally, Wireshark will store all capture data in a single file, which you can define at this point. If you don’t specify a file, Wireshark will automatically store the data temporarily, and you can use the File menu to specify a file in which you will store the data. The Use multiple files option also lets you spread the load over multiple files. You can also restrict the file size or the data volume by enabling a ring buffer. In this case, Wireshark will always overwrite older data when the defined thresholds are exceeded.
Start tells Wireshark to start recording data. To record the data traffic for the selected device, you need to run Wireshark for a while; Wireshark will permanently display the packets it has captured in the packet list. The functions in the Go menu let you navigate the packet list. You can now start, or ask the user to start, some typical applications such as web applications in the browser or VoIP tools. The Protocol option shows you the protocol group to which each IP packet belongs. After some time, you can then select Capture | Stop to stop recording, and Wireshark will display all of the packets it has captured (Figure 3).
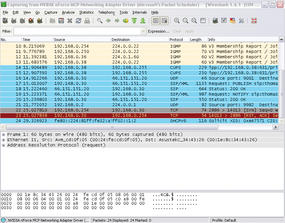
Figure 3: Launching Wireshark without filters makes the complete data traffic on the selected interface visible.
Wireshark Hands-On
The results window will mainly show you frequently recurring packets that belong to the same protocol group, such as Cups broadcasts, IGMP packets, DHCP requests, or ARP requests, which the network interfaces use to discover the IP address belongs to a MAC address. Additionally, routers or switches exchange information, and Samba or Windows hosts distribute browsing messages on the network; all of these things can be seen as normal network traffic.
In this simple example, notice that the local host with the IP address 192.168.0.30 has sent SIP packets to the target 66.151.151.20. Because Internet telephony is not used on this machine, this activity is well worth investigating. Double-clicking the packet opens a new Wireshark window with a detailed view; its title comprises the source IP, target IP, protocol, and an info text.
The info column in the list view states that SIP requests are addressed to the website at sip.sightspeed.com. Clicking the + in the detail window for Session Initiation Protocol confirms this fact. Back in the main window, right-click the offending packet and select Apply as Filter in the drop-down menu to create a display filter. To investigate all of the packets here, the Selected menu item is the correct choice. Wireshark shows you the syntax of the display filter you created in the line that appears highlighted in green.
Figure 4: Reduce the data volume by defining a filter that tells Wireshark to capture only the packets to or from a particular interface.
ip.src == 192.168.0.30
Next, press Apply to tell Wireshark to display the packets to or from this particular machine (Figure 4).
The sip.sightspeed.com service is run by Logitech, and after further investigation you can see that the user of this workstation installed a webcam some time in the past with Logitech’s own video telephony solution (Vid HD), which is used by the US VoIP provider Sightspeed. On the subject of VoIP, note that Wireshark offers a number of powerful functions and filters expressly for analyzing telephony problems in the Telephony menu.
Using Filters
If you don’t use any filters, Wireshark will capture the complete data traffic and present all of the packets required by the daily management of the network as the results, including ARP requests, NetBIOS and Cups broadcasts, and IGMP and STP (Spanning Tree Protocol) packets. In terms of network analysis, packets of this kind are typically irrelevant, unless you suspect an ARP poisoning attack. Thus, you should apply a capture filter to remove these packets while recording the results. Again, you need to open the Capture | Options dialog and enter a capture filter that uses libpcap syntax to the right of the Capture-Filter button.
The entry
host IP address
restricts the data volume to packets sent or received by the host with the specified IP address (Figure 5).
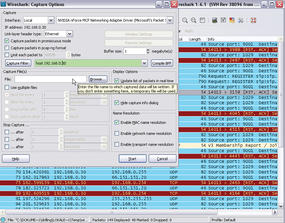
Figure 5: Capture filters can be formulated directly in the options dialog.
If you want to exclude the management packets described above, you can do something like this:
host IP address and not arp and not igmp
Many other useful practical examples of capture filters and display filters are available from the Wireshark wiki. Despite a relatively easy-to-understand and well-documented syntax, creating filters is a complex affair. Wireshark helps with a filter Toolbar in the Analyze | Display Filters menu.
In addition to selecting a number of predefined display filters, you can press the New button to enter filter expressions directly. Clicking the Expression filter lets you compile the required filter in a dialog (Figure 6).
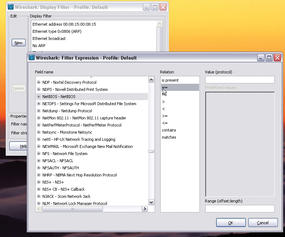
Figure 6: Display filters can be easily compiled in Wireshark in a dialog.
Although a similar function for capturing filters is accessible via the menu entry Capture | Capture-Filters, it does not give you an Expression button.
The filter dialog doesn’t just show the available protocol fields, but also displays the operators that you can use with the protocol in question in the Relation column. Experienced administrators will be able to combine these to create individual expressions.
When you’re done, press OK to transfer the expression to the filter list, then you can select the expression and press Apply.
Retrospective Analysis
All of the functions that I have looked at thus far relate mainly to capturing the data that you want to investigate. Filters are mainly used to restrict the anticipated data volume, but they can also restrict the investigation to possibly suspicious ports or protocols.
Additionally, Wireshark offers an impressive range of analysis functions in the Analyze menu. Besides using the toolbar to create display filters, you can also target and disable individual protocols here (Figure 7).
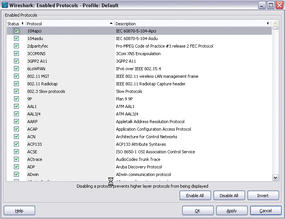
Figure 7: Wireshark supports a huge range of critical protocols that the administrator can use to filter data.
The Analyze | Expert Infos option is very powerful and useful; it provides an overview of the selected protocol sequence from which you can glean useful information for troubleshooting (Figure 8).
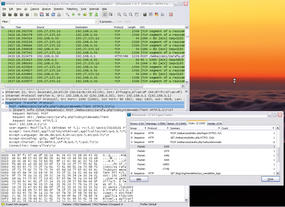
Figure 8: Wireshark lets you visualize the protocol sequence in detail.
For example, if you want to follow the details of an authentication handshake, Wireshark offers you a stream trace function in Analyze | Follow TCP Stream (alternatively, Follow UDP Stream and Follow SSL Stream). I’ll look at an example of an SSH login to illustrate this. To begin, you need to enable an SSH server on a second machine and then run Wireshark on the first machine and initiate an SSH login. Before doing so, you need to configure Wireshark to use a protocol filter that only records the packets belonging to an SSH session. To do so, you need to restrict the capture to the SSH protocol using either capture or display filters. The capture filter would look like this:
port 22
Then start capturing, initiate an SSH login at the console, and in the Analyze menu, select Follow TCP Stream. The result should look something like Figure 9 (see also “Colors” box).
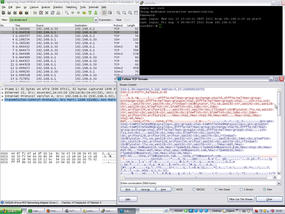
Figure 9: The ability to follow TCP or UDP streams packet by packet is really useful.
Because SSH connections are encrypted, a hacker will not be able to glean any useful information by deploying Wireshark. However, the example shows you how easily you could use the Follow TCP Stream to sniff a telnet login, for example, or – if you want something more up to date – an HTTP login that is not secured by SSL (see “Legal Note” box).
Statistics
Wireshark’s Statistics menu also offers useful statistics functions for IP addresses, packet lengths, protocol types, communication endpoints, conversations, service response times, and many other things.
The Statistics | UDP Multicast-Streams is both interesting and useful. If you suspect VoIP problems, or experience issues with Internet-based voice transmissions, you should check out the Telephony menu. It gives you a fast option for filtering data traffic for telephony data analysis purposes for both the signaling traffic (SIP) and the voice traffic (RTP) on UDP. With the Telephony | SIP … and Telephony | RTP menu items, you can easily create matching filters and generate statistics, a particularly powerful function. Telephony | RTP | Show All Streams quickly filters and visualizes all existing RTP streams. RTP stream analysis in Telephony | SIP | Stream Analysis then generates statistics for the selected RTP stream, including the arrival time of the packet, the delay, and the jitter.
Conclusions
Wireshark is one of the most powerful packet sniffers and is comparable to commercial products. This article only looks at a fraction of the available functionality. The supported protocols, built-in filters, and analysis functions alone could fill volumes.
However, in-depth network analysis doesn’t become easier with the use of wizards and filters if you do not have the required protocol knowledge. Additionally, use of Wireshark is typically a manual process even though the toolbox keeps on growing as each new version of the software arrives. If you don’t have in-depth network knowledge and understand how the protocols and services interact, Wireshark will not be able to help you discover performance weaknesses or configuration errors.
The Author
Thomas Drilling has been a freelance journalist and editor for scientific and IT magazines for more than 10 years. With his editorial office team, he regularly writes on the subject of Open Source, Linux, servers, IT administration and Mac OS X. Thomas Drilling is also a book author and publisher, a consultant to small and medium-sized companies, and a regular speaker on Linux, Open Source, and IT security.
Tags:
![]() network analysis ,
network analysis , ![]() port mirroring ,
port mirroring , ![]() protocol analysis ,
protocol analysis , ![]() Wireshark
Wireshark