More Small Tools

We look at some additional tools that you might find useful when troubleshooting HPC systems.
Everyday you can find interesting ways to administer HPC systems in Linux. In a previous article, some simple but extremely useful tools were presented that make life easier on HPC systems, including:
- ldd
- find
- ssh and pdsh
- sshfs
- vmstat
Of course, you can find other commands that are just as useful and can help tackle system problems.
watch
At some point, you will have to debug an application. It might belong to you or it might belong to another user, but you will be involved. Although debugging can be tedious, you can learn a great deal from it. Lately, one tool I've been using more and more is called watch.
The cool watch tool can greatly help you by just doing something extremely simple: run a command repeatedly and display the output to stdout. For example, assume a user has an application hanging on a node. One of the first things I want to check is the load on the node (i.e., whether it’s very high or very low). Rather than repeatedly typing uptime in a console window as the application executes, I can use watch to do this for me; plus, it will overwrite its previous output so you can observe the system load as it progresses without looking at infinitely scrolling terminal output.
For a quick example, the simple command
$ watch -n 1 uptime
tells watch to run a command (uptime) every second (-n 1). It will continue to run this command forever unless you interrupt it or kill it. You can change the time interval to whatever you want, keeping in mind that the command being executed could affect system performance.
Although it’s not particularly exciting, Figure 1 shows a screen capture from my laptop running this command.
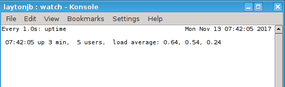
Figure 1: Output from the “watch -n 1 uptime” command.
One useful option to use with watch is -d, which highlights differences between iterations (Figure 2). This option gives you a wonderful way to view the output of time-varying commands like uptime.
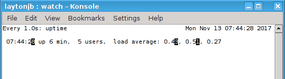
Figure 2: Output from the “watch -n 1 -d uptime” command.
You can see the changes that have been highlighted (I'm not using a color terminal, so they show up as characters with a black background). Notice that the time has changed as well as the first two loads.
One bit of advice around using watch is to be careful about passing complicated commands or scripts. By default, watch passes the command using sh -c; therefore, you might have to put the command in quotes to make sure it is passed correctly.
You can use watch in conjunction with all kinds of commands. Personally, I use it with uptime to get a feel for what’s happening on a particular node in regard to load. I do this after a node has been rebooted to make sure it’s behaving correctly. I also use watch with nvidia-smi on a GPU-equipped node, because it allows me to look at the load and the temperature on the GPU(s) and is great way to tell whether the application is using GPUs.
One thing I have never tried is using watch in conjunction with the pdsh command. I would definitely use a longer time interval than one second, because it can sometimes take a bit of time to gather all the data from the cluster. However, because pdsh doesn't guarantee that it will return the output in a certain order, I think the output will be jumbled from interval to interval. If anyone tries this, be sure to post a note somewhere. Perhaps you know of a pdsh-like tool that guarantees the output in some order?
An absolute killer use of watch to use it with tmux, a terminal multiplexer, on a node, which means you can take a terminal window and break it into several panes within the same terminal. If you are on a node writing code or watching code execute, you can create another pane and use watch to track the load on the node or the GPU usage and temperatures, which is a great way to tell whether the code is using the GPUs and when. If you use the command line, tmux and watch should be a part of your everyday kit.
whereis and which
The $PATH variable in Linux and *nix tells you the directories or paths that the OS will use when looking for a command. If you run the command voodoo and the result is an error message like can’t find voodoo, but you know it is installed on your system, you might have a $PATH problem.
You can look at your $PATH variable with the env command, but I like to use the simple whereis command, which tells you whether a command is in $PATH and where it is located. For example, look for perl (Figure 3). Notice that the output tells you where the man pages are located, as well as the binary.
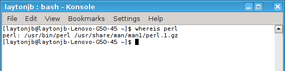
Figure 3: Output from the “whereis” command.
Think about a situation in which your $PATH is munged, and all of a sudden, you can't run simple commands. An easy way to find out what the problem is, is to use whereis. If the command is not in your $PATH, you can now use find to locate it – if it’s on the system.
Another useful command is which, which is very helpful for determining what version of a command will be run when executed. For example, assume you have more than one GCC compiler on your system. How do you know which one will be used? The simple way is to use which, as shown in Figure 4.
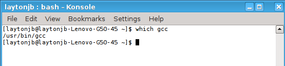
Figure 4: Output from the “which” command.
One way I use which quite a bit is when I create new modules for lmod, and on more than one occasion, I have damaged my $PATH so that the command for which I'm trying to write a module isn't in $PATH variable. Therefore, I know I managed to munge something in the module.
I promise you that if you are a system administrator for any kind of *nix system, HPC or otherwise, at some point, whereis and which are going to help you solve a problem. My favorite war story is about a user who managed to erase their $PATH completely on a cluster and could do nothing. They panicked pretty quickly before we were able to find the problem in a timely manner. (The problem was in the user’s .bashrc file, where they had basically erased their $PATH in an attempt to add a new path.)
lsblk
When I get on a new system, one of the first things I want to know is how the storage is laid out. Also, in the wake of a filesystem issue (e.g., it’s not mounted), I want a tool to discover the problem. The simple lsblk command can help in both cases.
As you examine the command, it seems fairly obvious that ls plus blk will “list all block devices” on the system (Figure 5). This is not the same as listing all mounted filesystems, which is accomplished with the mount command, which lists all network filesystems, as well.
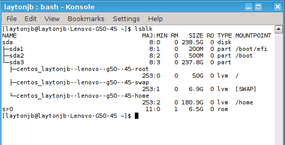
Figure 5: Output from the “lsblk” command.
The default “tree” output shows the partitions of a particular block device. The block device sizes, in human-readable format, are also shown, as is their mountpoint (if applicable). A useful option is -f, which adds filesystem output to the lsblk output (Figure 6).
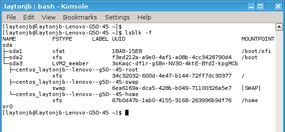
Figure 6. Output from the “lsblk -f” command.
kill
Sometime in your administrative career, you will have to use the kill command, which sends a signal to the application to tell it to terminate. In fact, you can send a whole host of signals to applications (Table 1). These signals can accomplish a whole host of objectives with applications, but the most useful is SIGKILL.
Table 1: Process Signals
| SIGHUP | SIGUSR2 | SIGURG |
| SIGINT | SIGPIPE | SIGXCPU |
| SIGQUIT | SIGALRM | SIGXFSZ |
| SIGILL | SIGTERM | SIGVTALRM |
| SIGTRAP | SIGSTKFLT | SIGPROF |
| SIGABRT | SIGCHLD | SIGWINCH |
| SIGIOT | SIGCONT | SIGIO and SIGPOLL |
| SIGFPE | SIGSTOP | SIGPWR |
| SIGKILL | SIGSTP | SIGSYS |
| SIGUSR1 | SIGTTIN | |
| SIGSEGV | SIGTTOU |
I call SIGKILL the “extreme prejudice” option. If you have a process that just will not die, it’s time to use SIGKILL:
$ kill -9 [PID]
Theoretically, this should end the process specified.
If for some crazy reason the process won't die (terminate), and you need it to die, the only other action I know of to take is to shut down the system. Many times this can result in a compromised configuration when the system is restarted, but you might not have much choice.
As with whereis and which, I can promise that you will have to use kill -9 to stop a process. Sometimes, the problem is the result of a wayward user process, and one way to find that process is to use the commands mentioned in this article. For example, you can use the watch command to monitor the load on the system. If the system is supposed to be idle but watch -n 1 uptime shows a reasonably high load, then you might have a hung process using resources. Also, you can use watch in a script to find user processes that are still running on a node that isn't accessible to users (i.e., it has been taken out of production). In either case, you can then use kill -9 to end the process(es).
Summary
I hope this and the previous article pointed out some useful commands for HPC administration. Although the commands tend to be very simple (e.g., watch),they can be very powerful; they are also very useful for plain old Linux administration, not just HPC. Keep these commands close by on a Post-it note; when you're beginning to debug an issue, a glance at the list will remind you to start with simple tools. You can move on to the “fancy” solutions after you have bound the problem. These tools have saved my bacon more than one time, and I hope they help you.
Although I poke fun at system users a little in these articles, just remember that without the users, we would have no need for HPC administration. They are capable of doing some really cool things; most of all, they are focused on their science, engineering, and research. I started in HPC by being a user, and I'm sure the system administrators were annoyed with me on more than one occasion. If I didn't say it then, let me say it now: Thank you for all the help.
I can’t finish this article without adapting a phrase from my time in the military:
If you drop off a soldier with a small hammer and an anvil in the middle of the desert and come back in eight hours, the anvil will be broken
The version for HPC administrators goes:
If you give a new user vi and a terminal, in eight hours the HPC system will be down
Tags:
![]() command line ,
command line , ![]() tools
tools