Frontpage
Back
Navigation
Remora F08
«
Previous
|
Images
|
Next
»
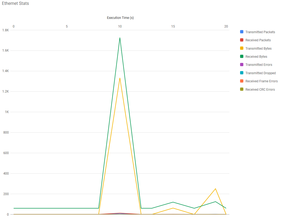
Figure 8: Example 2 Ethernet utilization plot.