
Log analysis can be used to great effect in HPC systems. We present an overview of the current log analysis technologies.
Analyzing Logs
In the last article on Log Management, I talked about options for gathering logs from distributed systems for manual searching, which is a typical task performed in high-performance computing (HPC). The topic of this article is the state of the art in log analysis and how it can be applied to HPC.
Log analysis can produce information through a variety of functions and technologies, including:
- ingestion
- centralization
- normalization
- classification and logging
- pattern recognition
- correlation analysis
- monitoring and alerts
- artificial ignorance
- reporting
Logs are great for checking the health of a set of systems and can be used to locate obvious problems, such as kernel modules not loading. They can also be used to find attempts to break into systems through various means, including shared credentials. However, these examples do not really take advantage of all the information contained in logs. Also, log analysis can improve system administration skills.
When analyzing or just watching logs over a period of time, you can get a feel for the rhythm of your systems; for example: When do people log in and out of the system? What kernel modules are loaded? What, if any, errors occur (and when)? The answers to these questions allow you to recognize when things don’t seem quite right with the systems (events) that the usual log analysis might miss. A great question is: Why does user X have a new version of an application? Normal log analysis would not care about this query, but perhaps the user needed a new version and could indicate that others might also need the newer version, prompting you to build and make it available to all.
Developing an intuition of how a system or, in HPC, systems behave can take a long time and might be impossible to achieve, but it can be accomplished by watching logs. If you happen to leave or change jobs, a new admin would have to start from scratch to develop this systems intuition. Perhaps you have a better way with the use of log analysis on your HPC systems. Before going there, I’ll look at the list of technologies presented at the beginning of this article.
Ingestion and Centralization
As stated in the previous article, this step is important for HPC systems because of their distributed nature. Larger systems would use methods that ingest the logs to a dedicated centralized server, whereas smaller systems or smaller logs might use a virtual machine (VM). Of course, these logs need to be tagged with the originating system so they can be differentiated.
When you get to the point of log analysis, you really aren’t just talking about system logs. Log ingestion also means logs from network devices, storage systems, and even applications that don't always write to /var/log.
A key factor that can be easily neglected in log collection from disparate systems and devices is the time correlation of these logs. If something happens on a system at a particular time, other systems might have been affected, as well. The exact time of the event is needed to search across logs from other systems and devices to correlate all logs. Therefore, enabling the Network Time Protocol (NTP) on all systems is critical.
Normalization
Normalization is just what it sounds like: It is the process of converting all or parts of the log content to the same format – most importantly for items such as the time stamp of the log entry and the IP address.
The tricky bit of normalization is automation. Some logging tools understand formats from various sources, but not all of them. You might have to write a small bit of code to convert the log entries into a format suitable for the analysis. The good news is that you only have to do this once for every source of log entries, of which there aren’t many.
Classification and Ordering
You can mix of all your logs into a single file or database, but this can make analysis difficult because the logs contain different types of information. For example, a log entry from a user logging on to a system has information that is different from a network storage device logging data throughput over the last five seconds.
You can classify the log messages into different classes, add tags to messages with keywords, or use both techniques for better log organization.
Pattern Recognition
Pattern recognition tools are typically used to filter incoming messages (log entries) according to a set of known patterns. This method allows common events to be separated out or handled differently from events that do not fit the pattern.
Although it might sound like you wouldn’t have to collect and store so much log information, you have to define the benign patterns, and you can lose quite a bit of information (more on that later in the article).
Correlation Analysis
Correlation analysis is a way to find all of the logs associated with an event, even if they are in different logs or have different tags. This method can be more important than you might think: If a user’s application doesn’t run as well as it did yesterday, you have to determine whether any new events occurred before the latest run. More specifically: What happens when a user’s application crashes? Do any events in the logs across various devices explain what could have caused this problem?
Monitoring and Alerts
Log analysis tools usually include the ability to notify you about events that might require human intervention. These events can be tied to alerts in various forms, such as email or dashboards, so you are promptly notified. A good simple example is the loss of a stream events to a system log. This usually requires a human to figure out why the stream stopped.
A second example is if environmental properties in a data center go beyond their normal levels. Early in my career a small group of engineers wanted to have a meeting in a data center, so they turned off all of the air conditioning units because they were too loud. As the ambient temperature went above a critical temperature, I got several email messages and a beeper page. (That shows you how long ago it was.)
Artificial Ignorance
Because hardware problems are fairly rare overall, Log analysis tools have implemented what they call “artificial ignorance,” which uses a machine learning (ML) approach to discard log entries that have been defined as “uninteresting.” Commonly, these entries are typical of a system that is operating normally and don’t provide any useful information (however “useful” is defined). The idea is to save log storage by ignoring and even deleting this uninteresting information.
My opinion, with which you can agree or disagree, is that artificial ignorance is not something I would enable for a long time. The uninteresting logs can provide information about how the system typically runs. For example, when do people log in to the system? When do users typically run jobs? A lot of day-to-day activities are important to know but are lost when artificial ignorance is used.
Although keeping or watching everyday activities might seem like Groundhog Day, I feel it is important for understanding the system. Dumping this data before you have a chance to develop this understanding is premature, in my opinion.
Ignoring the uninteresting data could also hinder understanding an event. In the previous section on correlation analysis, when an event occurs, you want to gather as much information around that event as possible. Artificial ignorance might ignore log entries that are related to the event but appear to be uninteresting. The entries could even be deleted, handicapping your understanding of the event. Lastly, this data can be important for other tasks or techniques in log analysis, as a later section will illustrate.
Reporting
Log analysis tools can create notifications and alerts, but many (most) of the tools can create a report of their analysis as well. The report is customized to your system and probably your management because the you will want to see all system problems – or at the very least, a summary view of the events.
Reports can also be your answer to compliance requests, with all the information needed to prove compliance (or show non-compliance). This feature is critical in Europe, where the General Data Protection Regulation (GDPR) topics are very important. If a request to remove specific data has been made, you must be able to prove that it was done. A log analysis tool should be able to confirm this in a report.
Examples of Log Analysis Stacks and Tools
All of the log analysis tools and stacks are different, flexible, and run in a specific manner. Some are created from various components, usually open source, and others are monolithic tools, so it would be too difficult to examine them all. Rather, I'm going to focus on a log analysis stack concept that illustrates the tools that fulfill the various tasks described at the beginning of the article. In this way, I hope to orient you in the correct direction for deploying a log analysis capability.
Splunk
Although I’m a big supporter of open source, Splunk, a commercial product, is probably the gold standard for a combination log collection and log analysis tool. It is the template security incident and event management (SIEM) tool that all others use for comparison. Honestly, though, Splunk is pretty costly for an HPC system and may be overkill.
Splunk came out in 2003 and was very quickly a big success. Arguably, it was the first enterprise-grade log collection and analysis tool that could monitor logs from many different devices and applications and locate patterns in real time. It also uses machine learning in its analysis, which was very innovative at the time and set the bar for similar tools. Splunk has a great number of features, is easy to install, uses data indices and events, and can ingest data from many sources. For an enterprise-grade tool, all of these features made it unique and powerful.
Sites started using Splunk, and its popularity grew and grew. However, as I mentioned, it’s fairly expensive, particularly for HPC systems, which has led to log analysis stacks and tools developed to compete with Splunk but still be open source; at the very least, less expensive; or both.
Splunk Alternatives
Given the preeminence of Splunk and the associated cost, people naturally will look for Splunk alternatives. An article about Splunk alternatives presents a few options but is not necessarily comprehensive. From that article, I gleaned a few options:
- LogDNA (commercial with open source agent; software as a service)
- Elastic Stack (aka the ELK stack)
- Elasticsearch (search and analytics engine)
- Logstash (log collection transformation)
- Kibana (visualization)
- Beats (data shippers, not really part of ELK, but added to Elastic Stack)
- Fluentd (open source)
- Sumo Logic (commercial)
- Loggly (uses open source tools, including Elasticsearch, Apache Lucene, and Apache Kafka)
- Graylog (open and commercial versions)
Most of the open source tools and stacks have a company behind them that offer support, proprietary plugins, additional capability, or a combination of features for a price.
Rather than dig into the tools and stacks, I’m going to discuss the ELK stack and its components briefly. This stack was the original open source log analysis stack designed to replace Splunk but has morphed into the Elastic Stack while adding an additional tool, Beats, a collection of data shipper tools.
Elastic Stack (ELK)
ELK stands for Elasticsearch, Logstash, and Kibana and was put together to provide a complete log management and analysis stack that is all open source and competitive with Splunk. In my previous article, the steps or tenets for log collection, management, and analysis were listed as:
- log collection
- log/data conversion/formatter
- log search/analysis
- visualization
For the ELK stack, the tools that fulfill these steps are:
- Logstash (log/data collection, conversion, formatter)
- Elasticsearch (log search/analysis)
- Kibana (visualization)
A fourth tool, Beats, a collection of lightweight data shippers, was later added to the stack, which was renamed Elastic Stack.
The ELK stack was a big hit because it was completely open source and provided a good portion of the capability found in Splunk. Its popularity grew quickly and even Amazon Web Services (AWS) offered the ELK stack components as managed services. Theses components can be used together and with other AWS services.
The Elastic company develops the tools in ELK and Elastic Stack, offers support, and develops commercial plugins.
Gathering the Data
Logstash serves the purpose of gathering and transforming logs from the various servers (classification and ordering). It ingests the logs or data from the specified sources and normalizes it, classifies it, and orders it before sending it to the search engine, which is Elasticsearch in the ELK stack or in Elastic Stack.
Installing and configuring Logstash is covered in a Getting Started article from Elastic. Each client system runs a small tool named Filebeat that collects data from files on that server and sends it to the log server that is running Logstash. This tool allows you to specify system logs or the output of any scripts you create or any applications.
Filebeat takes the place of log gathering tools such as syslog-ng or rsyslog in general but isn’t strictly necessary. If you have a server already logging to a central log, you can install Filebeat on that server and the logs will be transmitted to the Logstash server as JSON (JavaScript object notation), which can be the same server, easing the upgrade from a just log collection to log analysis.
Searching the Data
Logstash gathers the logs and transforms them into a form the search engine, Elasticsearch, can then consume (JSON). Elasticsearch is an open source tool that is based on the Apache Lucene library. You can configure Elasticsearch to gather whatever information you need or want, but the defaults are a good place to start.
Besides being open source, Elasticsearch has some attractive features. One aspect that HPC users will understand and appreciate is that it is distributed. If you have lots of data and want to improve performance, you can shard data across several servers.
Elasticsearch also has near real time performance, perhaps close to Spunk’s performance, that gives you quick insight into problems and perhaps overcome them as quickly. While searching, it creates an index for the data that is very useful if you want to see all of the data related to an event, look back at the system logs and data, or both.
The core of Elasticsearch is in Java, but it has clients in various languages, including, naturally, Java, but also .NET (C#), PHP, Apache Groovy, Ruby, JavaScript, Go, Perl, Rust, and Python. These choices provide a great deal of flexibility of Elasticsearch.
The company behind Elastic Stack is Elastic. They develop all the tools in the stack: Logstash, Elasticsearch, Kibana (more on that in the next section), and Beats (data movers). They also created the Elastic Cloud service.
Visualizing the Data
Humans are great pattern recognition engines. We don’t do well when text zooms by on the screen, but we can pick out patterns in visual data. To help us, the tool Kibana (Figure 1; CC BY-SA 4.0) ties into Elasticstack to provide visualization. At a high level, it can create various charts of pretty much whatever you want or need.
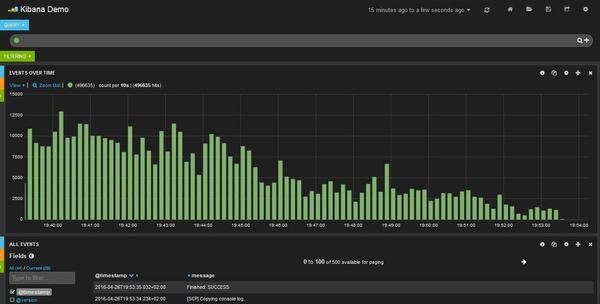 Figure 1: Sample Kibana screenshot (CC BY-SA 4.0).
Installing Kibana is easiest from your package manager. If you read through the configuration document, you will see lots of options. I recommend starting with the defaults before changing any of them. The documentation starts with alert and action settings followed by lots of other configuration options.
ELK Stack Wrap Up
Other components plug into the ELK stack. Fortunately, they have been tested and developed somewhat together so they should “just work.” Most importantly, however, they fulfill the components of a log analysis system set out in the previous article, including log collection, log data conversion and formatting, log search and analysis, and visualization.
AI
The previous discussion mentioned machine learning in log analysis – in particular, artificial ignorance, which uses machine learning to ignore and possibly discard log entries before searching the data and look for patterns. Pattern recognition also uses machine learning. As I discussed, although I don’t know the details of how the machine learning models make decisions, I am not a big fan of discarding data just because it looks normal. Such data might be very useful in training deep learning models.
A deep learning model uses neural networks to process input data to create some sort of output data. These networks are trained with sample data for the inputs and has the matching expected output(s). To train such a model adequately, you need a very large amount of data that spans a wide range of conditions.
The data should be balanced according to the desired outputs for non-language models. For example, if you want to identify an image and you have defined 10 possible image classes, then the input data should be fairly evenly distributed across each of the 10 classes. You can see the effect of a bad distribution if you run test images through the model and it has difficulty classifying images into a specific class. It might identify a cat as a dog if you don’'t have enough data, enough data in each class, or a broad enough data set.
If you are interested in special images or events that happen only very rarely, developing an appropriate dataset is very difficult and, as a result, makes it difficult to create an adequately trained model. An example of this is fraud detection. The model is supposed to identify when a fraudulent transaction happens. However, these are very rare events despite what certain news agencies say.
If you take data from transaction processing, you will have virtually the entire dataset filled with non-fraudulent data. Perhaps only a single-digit number of fraudulent transactions are in the dataset, so you have millions of non-fraudulent transactions and maybe three or four fraudulent transactions – most definitely a very unbalanced dataset.
For these types of situations, you invert the problem by creating a model to find the non-fraudulent transactions. Now you have a data set that is useful in creating the model. You are throwing millions of transactions at the model for it to learn with basically one output: Is the transaction fraudulent? A fraudulent transaction will then be relatively easy for the model to detect. Of course, other approaches will work, but this is a somewhat common approach of training models to detect rare events. Therefore, you shouldn’t discard the non-interesting data because it can be very useful to train a neural network model.
In the case of HPC systems, the trained deep learning model can be used to augment your observations as to the “normal” behavior of a system. If something doesn’t seem typical, then the model can quickly notify you. In HPC systems, non-typical events can be infrequent. For example, a user starts logging into the system at a later time or they start running different applications. Therefore, the dataset for HPC systems could have a fair number of events, and you don't have to “invert” the model to look for non-events.
Nvidia Morpheus
I want to mention a new tool from Nvidia designed for cybersecurity. In full disclosure, I work for Nvidia as my day job, but I’m not endorsing the product, nor do I have any inside knowledge of the product, so I use publicly available links. That said, Nvidia has a new software development kit (SDK) that addresses cybersecurity with neural network models. The SDK, called Morpheus, is “… an open application framework that enables cybersecurity developers to create optimized AI pipelines for filtering, processing, and classifying large volumes of real-time data.” It provides real-time inferencing (not training) on cybersecurity data.
Log analysis looks for cybersecurity-like events and includes true cybersecurity events. The product web page lists some possible use cases:
- digital fingerprinting
- sensitive information detection
- crypto mining malware detection
- phishing detection
- fraudulent transaction and identity detection
- ransomware
The digital fingerprinting use case “Uniquely fingerprint[s] every user, service, account, and machine across the enterprise data center — employing unsupervised learning to flag when user and machine activity patterns shift," which is great for watching for break-ins on HPC systems but also for watching shifting patterns. Instead of developing a fingerprint of user behavior, it could be used to create a fingerprint of application versions. For example, if a user starts out using a specific version of an application, but as time goes on, begins using a newer version, this event would signal the administrator to install and support the new version and consider deprecating any old versions. This scenario is especially likely in deep learning applications because frameworks develop quickly, new frameworks are introduced, and other frameworks stop being developed.
Another example might be job queues that are becoming longer than usual, perhaps indicating that more resources are needed. A model that detects this event and creates information as to why would be extremely useful.
The framework could also be used to watch data storage trends. Certainly storage space will increase, but which users are consuming the most space or have the most files can be identified and watched in case it is something unusual (downloading too many KC and The Sunshine Bad mp4s to the HPC). There really are no limits to how Morpheus could be used in HPC, especially for log analysis in general.
Summary
Log analysis is a very useful tool for many administration tasks. You can use it for cybersecurity, understanding how an HPC cluster normally behaves, identifying events and trends within the cluster and the need for more resources, or anything you want to learn about the cluster. The use of log analysis in your HPC systems is up to you because it can mean adding several servers and a fair amount of storage. However, don’t think of log analysis as just a cybersecurity tool. You can use it for many HPC-specific tasks, greatly adding to the administration of the system. Plus it can make pretty reports, which management always loves.
The future of log analysis will probably morph into an AI-based tool that takes the place of several of the log analysis tools current in use. Instead of a single trained AI, a federated set of trained networks will probably be used. Other models will likely go back and review past logs, either for training or to create a behavior description of how the cluster operates. This area of HPC technology has lots of opportunities.