
Fairly recently, a new top-like tool has received quite a bit of attention: bashtop, like other top-like tools, shows stats for the processor, memory, disks, network, and processes. Although it might sound like any other top tool, the interface is exceptional.
Bashtop, a Gorgeous Top-like Tool
Top Tools
The simple monitoring tool top is often used to monitor individual systems and can be used for debugging. Because it is such a valuable and highly used tool, similar tools have been created to improve upon it. I did a survey article in late 2014 that mentions several top-like tools, some of which have evolved since then and some that have not).
One of the more common top-like tools, htop, is a bit more interactive than top, but it provides very similar information. Htop uses ncurses for the interface but reads the data from /proc, as top does. It has a nice graph at the top of the default screen that presents the “load” on each of the cores. Htop is also known for its interactivity with processes.
Although htop is one of the most popular top-like tools, as of this writing (May 2020), the main branch hasn't been updated for 16 months. Although not necessarily a bad thing, it is something to be noticed.
Another top-like tool is atop. Like top, the first part of the output is a summary of system statistics and a list of the major processes appears at the bottom. Atop breaks out the system, user, and idle time for the system cores. (It would be fun to try this on a 64-core CPU.) The top portion also covers network and disk information.
Atop has a few keyboard shortcuts that allow you to dive deeper into various system aspects. For example, pressing the m key allows you to see memory details, d allows you to see more disk (I/O) details, and u allows you to get information on a per-user basis. One very interesting feature of atop is that it can show GPU activity on a system and per-process level. (Also see the “GPUs” box.)
As of this writing, the main branch of atop is still under active development, with code updated within the last six days.
I wrote the top-like tool review article about six years ago. A lot can happen in six years. In 2014, the top consumer GPUs were the Nvidia GeForce GTX 970 and the AMD Radeon R9 290, and the top data center GPU was the Nvidia K80, which was the last of the Kepler series of GPUs that started in 2012. One could argue that the Kepler series, particularly the K80, was the elbow in GPU computing popularity. Therefore, top-like tools in the original survey article did not really pay attention to monitoring GPUs.
Now, GPUs are much more pervasive, and it seems logical that top tools would be able to monitor them, even though it’s not easy to gather statistics because they have different architectures. Given the interest in GPUs, though, the tools should be adapted to monitor them.
A third top-like tool that I’ve used is vtop, which is very unique, in that it has a “strip chart” at the top of the screen that that shows system CPU usage over time. The bottom left of the default screen also shows memory usage in a similiar manner. Unfortunately, the main branch of vtop has not been updated for a couple of years.
Bashtop
The bashtop resource monitor is written in Bash – quite a bit of Bash. This top-like tool accepts no mouse input. All input is from the keyboard, which I find very easy and efficient. At the top of the screen output (Figure 1) is a plot of the CPU load as a function of time (a strip chart). The green color indicates that the workload is low. As it increases, the color switches to yellow, and then red. Just to the right of the strip chart is a CPU load summary with the CPU type and load for each core.
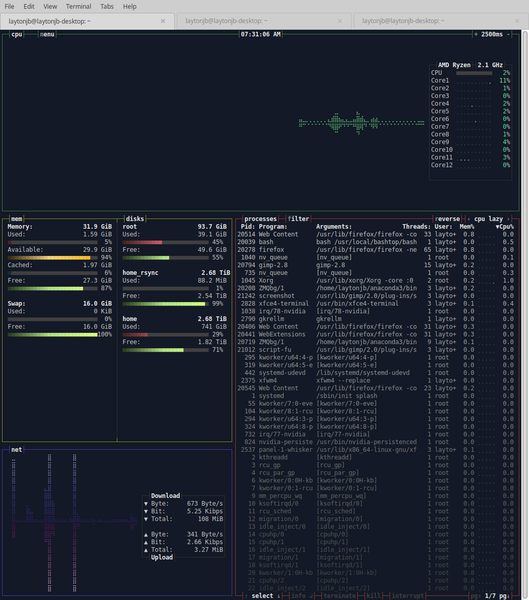 Figure 1: The bashtop interface.
Just below the strip chart and on the left side of the screen are plots of memory usage (used, cached, and free, as well as swap space). To the right of the memory charts is a set of plots for disk usage. This example shows three disks, root, home_rysnc, and home. For both the memory and disk statistics, the total memory used and the total disk space used are at the top. The disk space is given for each disk in the system. Notice that the charts get brighter as you near the top, or 100%, value. Read the values carefully because sometimes nearing 100% is a good thing, such as the amount of memory available.
To the right of the memory and disk charts is a list of processes that shows the:
- Pid
- Program name
- Arguments
- Number of threads used in the process
- User of the process
- % Memory
- % CPU
Notice how the text gets darker near the bottom of the list, which indicates that bashtop assumes these processes are not as important as the those near the top.
Pressing f creates a filter for the processes. For example, you could enter a specific process name. From the filter you can then select the specific process you want by pressing the Up and Down arrow keys. When you find the process of interest, pressing Enter brings up information about the process in a new box (subbox), which shows on the left side a small strip chart of CPU usage – very similar to the CPU chart – with green, yellow, and red colors. On the right side of the subbox are listed:
- Status
- Elapsed time
- Parent process
- User
- Number of threads
- Memory usage (% memory and actual memory used)
- CMD (vertical) – the command used to run the process
- Pressing f removes the process filter box.
Rather than rely on entering a filter, in the process table you can highlight a process with the Up and Down arrow keys and press one of three keys – t, k, or i – to terminate, kill, or interrupt, respectively, the highlighted process.
Finally, on the screen at bottom left is a chart of network usage (shown in blue in Figure 1). A small table of net usage shows both download and upload totals. These charts auto-scale as the network usage changes.
Once you are done with bashtop, you press the q key to quit.
A standard system should have everything installed to run bashtop, which has no other dependencies. The only thing you might want to pay attention to is your version of Bash. If you use lm-sensors, bashtop will display CPU temperatures, as well.
If you remember the computer games from a number of years ago, you will recognize the game-inspired menus in Bashtop that come up when you press the m key (Figure 2).
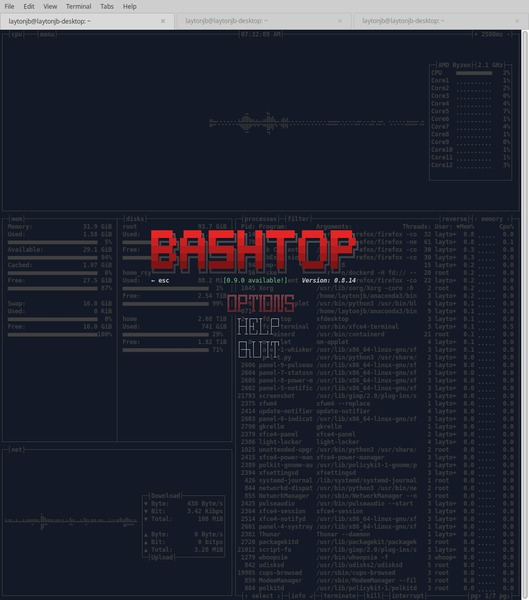 Figure 2: The mainBashtop menu.
Maneuvering to OPTIONS with the arrow keys shows details about the configuration (Figure 3). From here, you can change the color theme, check temperatures (I do not have lm-sensors installed), and change a few other settings. A fairly short YouTube video about bashtop has more information.
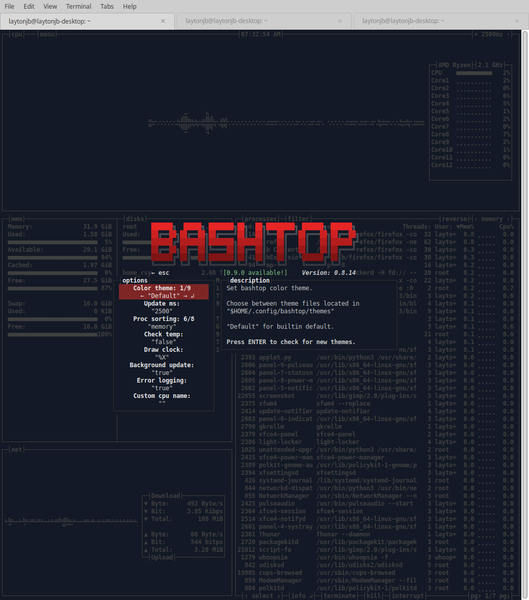 Figure 3: Bashtop OPTIONS menu.
In my humble opinion, bashtop has to have the most beautiful, usable interface of any top-like tool. Even better, it’s written in about 3,400 lines of Bash. The main author is taking some time to rewrite parts of bashtop so that it uses psutil, a popular library of simple system monitoring tools, and thus reducing the number of lines of code.
These changes do create Python and psutil dependencies, but Python is very commonly installed, and psutil is not very large, so the new code will not drift too far from the simplicity of Bash. Moreover, psutil is cross-platform, so rewriting with psutil can bring bashtop closer to being cross-platform, as well.
Summary
I love the creativeness of these top-like tools. They have taken the basic concepts in top and extended them to create really powerful tools. For a quick glance at what is happening on a system, I run top, or maybe htop, but to be honest, bashtop really is much better, and I’ll be making it a part of my daily admin skills.