« Previous 1 2 3 Next »
TUIs, a Smoke-Jumping Admin’s Best Friend
TUI Tools
Even today you can find many examples of TUI applications. They are very fast – faster than GUIs – and easy to use. They help CLI applications that have a large number of options and often provide visual feedback. Many of these tools are widely used, including on HPC systems, to collect statistics across the cluster and manage nodes; they are ideally suited for debugging and testing a small number of nodes.
TUIs are still popular for general applications, although perhaps not so much as administration tools. Nonetheless, they are still used and new ones are still being developed. Table 1 lists a number of administrative and non-administrative TUIs.
Table 1: Example TUIs
| TUI | Function | Resource |
| Administrative TUIs | ||
| bmon | Monitoring and debugging tool designed to capture and display networking statistics; capable of text-based plots. | A short YouTube video illustrates bmon. |
| nmon | General admin, tuner, and benchmark tool capable of text-based plots, some of which are almost in real time. | A short video on YouTube illustrates how to install and use nmon. |
| htop | Written in C and curses, htop is a very popular replacement tool for top and displays charts at the top of the interface. | A good article and a YouTube video explain htop. |
| iftop | Presents network usage for each user in something like a top format; written with the use of libpcap and ncurses. | A YouTube video explains a bit about iftop. |
| vtop | A TUI replacement for top written in Node.js, with scrolling charts at the top (CPU usage) and the bottom left (memory usage). | A good YouTube video presents vtop. |
| iptraf | Provides network statistics. | A YouTube video explains IPTraf. |
| Glances | A system monitoring tool for providing the maximum information in the minimum amount of space (i.e., it presents a ton of information on the screen). It is written in Python with XML-RPC, has a RESTful JSON API that can be used by other tools, and uses the psutil Python library (see below). | Several videos on YouTube discuss Glances usage. |
| atop | A TUI performance monitoring tool for Linux. | This article on atop is worth reading, as well as a reasonably good YouTube video on installing and using atop. |
| dstat | A very well known admin tool designed to replace vmstat, iostat, netstat, and ifstat in a single tool; written in Python and curses. | Many tutorials on the web discuss dstat, along with some good intros on YouTube. |
| psutil | A tool or library for gathering system statistics. It can be used to create all kinds of TUIs for system administration. It is written in Python and has bindings for other languages. It also can be coupled with curses-based plotting, if desired. | A video explains some uses for psutil on YouTube. |
| Non-administrative TUIs | ||
| system-config-firewall-tui | This TUI-based firewall could be considered an administrative tool. | A good video explains how to use it. |
| neoleo | A text-based spreadsheet built with C and curses. | Online documentation walks you through neoleo. |
| cmus | An excellent console music player with an easy-to-use interface; written in C and ncurses. | This tool offers documentation and a wiki. |
| Midnight Commander (mc) | Probably the most popular TUI-based tool in Linux, this file management tool is written in C and ncurses. | Midnight Commander only offers drafts of the documentation project. |
| vifm | A dual-pane file manager written in curses that uses Vi-like bindings. | Vifm offers two versions of a man page and a cheatsheet. |
| SC-IM | A text spreadsheet that can use gnuplot for charting; written in C and curses. | SC-IM offers a wiki on its GitHub page. |
| Mutt | A text-based email client that is still very popular. | Mutt has online documentation and a wiki. |
| ncdu | A curses-based disk usage tool written in C. | Ncdu has a man page-style manual. |
Writing TUIs
Rather than just present a list of TUI applications that can be used for administration or as everyday applications, I will illustrate that it is fairly straightforward to write these applications, particularly for administration tasks.
A few main libraries or toolkits have been helpful; the first, and probably largest, is curses. Originally written in the late 1970s, curses was optimized and expanded in the early 1980s for the video game Rogue. It then began to be used for a number of applications. Development of curses slowed down, and a new library, ncurses, was developed that proved to be more popular than curses. As part of the GNU Project, it is still being developed, although at a slower pace. Figure 1 shows a sample ncurses screenshot.
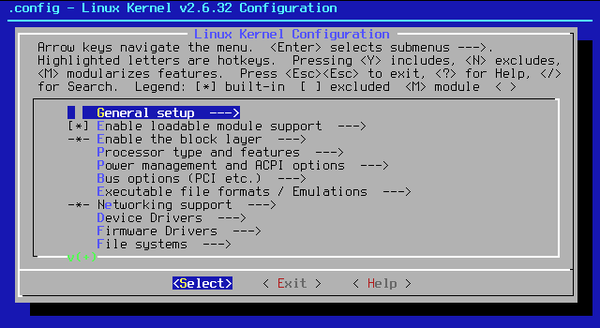 Figure 1: ncurses-based menuconfig (Wikipedia, CC BY-SA 3.0).
Another option is the Newt library, which focuses on color TUIs (Figure 2) and uses a widget approach, making programming a TUI much easier. With Newt, you can create stacked windows, entry widgets, checkboxes, radio buttons, labels, plain text fields, scrollbars, and so on. In Python, this library is referred to as snack and was originally developed for Red Hat’s TUI installer, Anaconda.
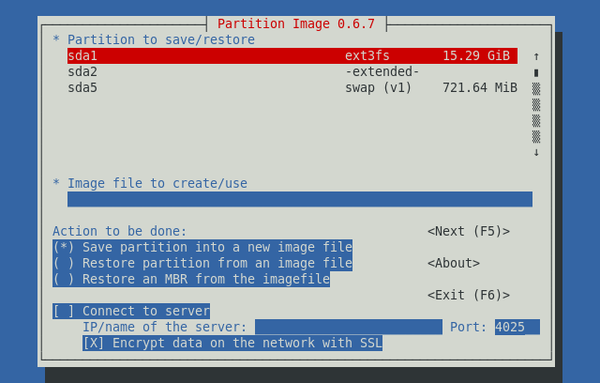 Figure 2: The Partimage tool uses Newt to create its user interface (Wikipedia, GPL).
A number of tutorials on the web can guide you in using Newt with pretty much any language you want. (Sorry, Fortran-ers, I don’t see anything for us yet.) Python is a fairly common language for using Newt (python-snack), and a Jupyter notebook can help you learn Newt in Python.
Another useful TUI library that can be used with Python and Bash is called dialog, which you can use to create pop-up dialog boxes from Bash scripts (Figure 3). Furthermore, dialog has been rolled into a Python library named, aptly enough, pythondialog that allows you to use dialog boxes and other constructs from the dialog library in your Python code.
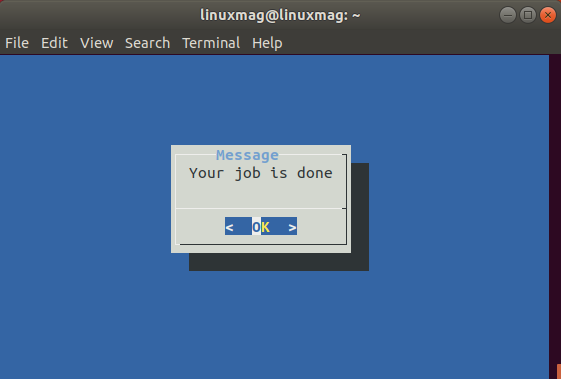 Figure 3: Sample pop-up dialog from Bash script: dialog --title "Message" --msgbox 'Your job is done' 6 20
If you are interested in writing TUIs for system administration, a great place to start is with the psutil library, which is great for gathering system statistics. Then, you can take a look at the scripts subdirectory on GitHub, where you can find a number of sample scripts for creating a TUI (e.g., the top clone top.py). You can also look at other TUIs to understand how to create plots, strip charts, and other useful features. Don’t forget, these interfaces are all text based and can be easily used over port 22 (SSH).
Be sure to examine the admin tools mentioned in Table 1. The charting capability, even with just text-based graphics, is great. I love using these tools to get a simple view of how a node is behaving. Take a look at the code and even think about a way to make a function for creating these plots (please create Python interfaces to make life easier).
« Previous 1 2 3 Next »