« Previous 1 2 3 Next »
Resource Monitoring For Remote Applications
Installing Remora
Installing Remora is not difficult; the approach is slightly different from the usual ./configure; make; make install. You also need to be aware that because Remora can provide MPI statistics, you need to build it with the intended version of MPI (i.e., don’t cross MPIs). I built Remora with the command,
REMORA_INSTALL_PREFIX=/home/laytonjb/bin/remora-1.8.2 ./install.sh
which installs to a directory in my home account. If more than one user is to have access, you can install Remora in a common directory.
If you use multiple versions of MPI, you need to build Remora for each version. If you are using environment modules (e.g.,Lmod), you can write a module for Remora, so it is added to the environment when the corresponding MPI module is loaded.
Using Remora
Remora is very simple to use: Just prepend it to your original command. For example, a simple command line for application ./myapp.exe would become:
$ remora ./myapp.exe
In the case of MPI code, a command line would be something like
$ remora mpirun ... ./mpiapp.exe
if the original command was mpirun … /mpiapp.exe. Notice that both commands are run as user, not root, which goes back to the design of Remora: a focus on users and providing them with useful information.
This next example is Fortran 90 code for a simple serial Poisson solver for a rectangular grid (poisson_serial.f90). Remora captures data every 10 seconds by default, so you need to adjust a few application parameters in the Fortran programfor a longer run time:
- nx = 8000
- ny = 8000
- it_max = 10000
- tolerance = 0.00004D+00
The code was compiled using GCC 7.1 and run on a four-core AMD A6-6310 laptop (Lenovo-G50-45). The output from the code and a summary from Remora are shown in Listing 1. Notice that it gives you the maximum memory used per node, as well as the run time of the application and the sampling time. It also lists the directory with the Remora output.
Listing 1: poisson_serial.f90 Output
[laytonjb@laytonjb REMORA_TEST]$ remora ./poisson_serial
23 August 2017   7:12:50.609 PM

POISSON_SERIAL:
  FORTRAN90 version
  A program for solving the Poisson equation.

  -DEL^2 U = F(X,Y)

  on the rectangle 0 <= X <= 1, 0 <= Y <= 1.

  F(X,Y) = pi^2 * ( x^2 + y^2 ) * sin ( pi * x * y )

  The number of interior X grid points is     8000
  The number of interior Y grid points is     8000
  The X grid spacing is     0.0001
  The Y grid spacing is     0.0001
  RMS of F =    5.99663
  RMS of exact solution =   0.622184

  Step    ||Unew||     ||Unew-U||     ||Unew-Exact||

      0    0.111796E-01                    0.622083
      1    0.115237E-01    0.279491E-02    0.622039
      2    0.119603E-01    0.156240E-02    0.622010
      3    0.123543E-01    0.113207E-02    0.621986
      4    0.127060E-01    0.904517E-03    0.621966
      5    0.130230E-01    0.761265E-03    0.621948
      6    0.133121E-01    0.661767E-03    0.621931
      7    0.135782E-01    0.588130E-03    0.621916
      8    0.138253E-01    0.531152E-03    0.621901
      9    0.140562E-01    0.485586E-03    0.621888
     10    0.142734E-01    0.448208E-03    0.621875

...

    246    0.266937E-01    0.402086E-04    0.620868
    247    0.267182E-01    0.400864E-04    0.620866
    248    0.267427E-01    0.399651E-04    0.620863
  The iteration has converged,

POISSON_SERIAL:
  Normal end of execution.

23 August 2017   7:21:31.215 PM

=============================== REMORA SUMMARY ===============================
 Max Memory Used Per Node     : 31.55 GB
*** REMORA: WARNING - Free memory per node close to zero.
 Total Elapsed Time           : 0d 0h 8m 40s 632ms
==============================================================================
 Sampling Period              : 10 seconds
 Complete Report Data         : /home/laytonjb/REMORA_TEST/remora_1503529969
 Graphical Results At         : /home/laytonjb/REMORA_TEST/remora_1503529969/reora_summary.html
==============================================================================
Remora creates a subdirectory to contain the system information over time. For this particular test, that subdirectory is remora_1503529969, in which I find a number of subdirectories with the raw data. Although you can parse the data in your subdirectories if you like, Remora creates a web page (HTML) that plots the data for you and is the easiest way to get a quick glimpse of what happened during application execution. Just open the web page in your favorite browser (Figure 1).
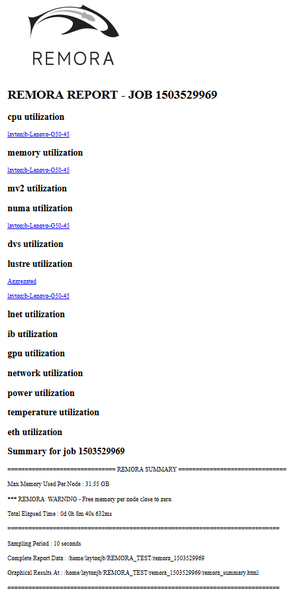 Figure 1: Summary web page.
The summary page lists the system metrics that Remora is capable of monitoring. A link below the metric means the corresponding data is available. Notice that for this simple case, only some of the metrics have been monitored. If you click the first link under "cpu utilization," you will see the plot in a new tab (Figure 2).
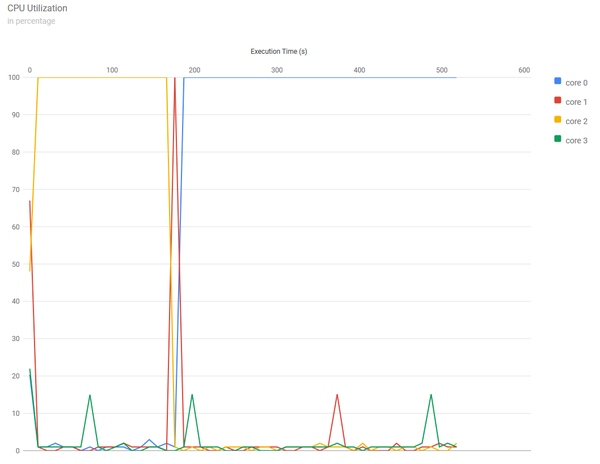 Figure 2: CPU utilization.
This laptop only has four cores, and Remora monitored all of them. Notice that the kernel moved the application from core 2 to core 1 (very briefly), and then to core 0 around 170–180 seconds into the run. The other cores don't run much of anything except system tasks.
The next obvious plot to examine is memory utilization (Figure 3), which includes the following:
- TMEM (Max): Maximum total memory (takes into account the memory not being used by the application, the libraries needed by the application, and the OS).
- MEM (Free): Free memory.
- SHMEM: Shared memory (/dev/shm). Applications have access to shared memory by means of /dev/shm. Any file put there counts toward the memory used by the application.
- RMEM: Resident memory – physical memory used by the application.
- RMEM (Max): Maximum resident memory.
- VMEM: Virtual memory (important to watch if the OOM killer kicks in)
- VMEM (Max): Maximum virtual memory.
These memory metrics are gathered from /proc/[pid]/status and /dev/shm.
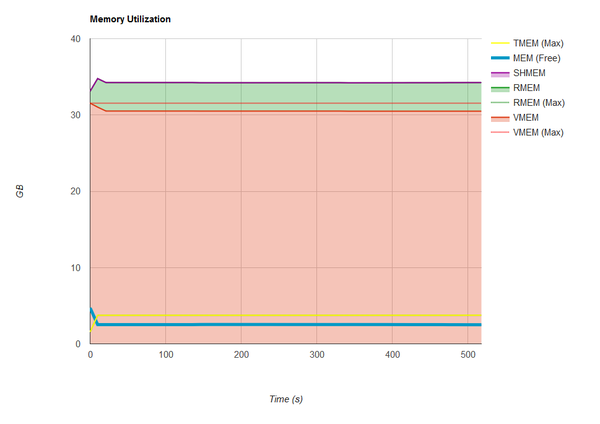 Figure 3: Memory utilization.
« Previous 1 2 3 Next »