
We look at management tools and good management habits for Linux and proprietary storage solutions.
Tools to Manage Storage
The last several articles have focused on answering the question, "How do I manage storage?" The reason it’s taken several articles to answer this question is because storage management has so many aspects. I began answering the question by splitting storage into two parts: proprietary storage solutions and Linux-based solutions.
Every proprietary storage solution has its own set of tools for managing and monitoring the hardware and the filesystem. Storage vendors have documented their tools well, and I wouldn't be adding anything if I wrote about them. Addressing Linux storage solutions led to the last several articles discussing topics such as,
- labeling and partitioning storage devices
- LVM
- Linux software RAID
- filesystems – creating filesystems on Linux, mounting and unmounting, basic tools (mountpoints and filesystems), checking and repairing filesystems, and network filesystems, including NFS (server and client) and SSHFS
These articles weren’t meant to be “how-to” instructions, but rather an overview of the tools and how they fit in Linux storage solutions. Now that the basics have been discussed, I'm finally ready to discuss management tools and what I consider to be good storage management habits. Many of the tools and topics apply not only to Linux solutions, but to proprietary solutions, as well.
Checking the State
When I log onto a system in the morning and I look at the storage, I begin by checking the “state” of the hardware, network, and filesystem. Proprietary solutions have a set of tools to check the hardware and the filesystem. In the series of articles on Linux storage, I've tried to point to tools for managing and monitoring the storage stack where possible.
Regardless of whether you work with proprietary or Linux-based storage, the first step is to check filesystem usage. One of the several ways includes a stack rank of the biggest capacity users.
df
I like to start with the Linux command df, which should work for either Linux or proprietary storage solutions to determine how much total storage space is available or used (Listing 1). The output gives you some very useful information, although I don't think in terms of 1KB blocks. So, I add the -h option to get a more human-readable form (Listing 2), with storage reported in megabytes, gigabytes, and terabytes.
Listing 1: Linux df Command
$ df
Filesystem                                    1K-blocks       Used  Available Use% Mounted on
tmpfs                                          26377272       2512   26374760   1% /run
/dev/nvme0n1p2                                490617784  142282252  323340052  31% /
tmpfs                                         131886348          0  131886348   0% /dev/shm
tmpfs                                              5120          8       5112   1% /run/lock
/dev/nvme1n1p1                                983378332  752658956  180692832  81% /home
/dev/nvme0n1p1                                   523248       6220     517028   2% /boot/efi
/dev/sda1                                    5813176856 3273282028 2246852396  60% /home2
192.168.4.100:/home/laytonjb/work_laptop_dir  977421312  524672000  403025920  57% /mnt/work_laptop_dir
tmpfs                                          26377268        108   26377160   1% /run/user/1000
Listing 2: Human-Readable df
$ df -h
Filesystem                                    Size  Used Avail Use% Mounted on
tmpfs                                          26G  2.5M   26G   1% /run
/dev/nvme0n1p2                                468G  136G  309G  31% /
tmpfs                                         126G     0  126G   0% /dev/shm
tmpfs                                         5.0M  8.0K  5.0M   1% /run/lock
/dev/nvme1n1p1                                938G  718G  173G  81% /home
/dev/nvme0n1p1                                511M  6.1M  505M   2% /boot/efi
/dev/sda1                                     5.5T  3.1T  2.1T  60% /home2
192.168.4.100:/home/laytonjb/work_laptop_dir  933G  501G  385G  57% /mnt/work_laptop_dir
tmpfs                                          26G  108K   26G   1% /run/user/1000
The df command can be used in several ways. One way is to generate a time history of storage usage. You run the command once a day (or more) and capture the output; then, you can create a time history plot of the import filesystems and plot the usage, availability, or usage percentage. From this plot you can get a trajectory of the storage usage, which you can use for predictive purposes, such as estimating when you might need additional storage.
You could add markers to the time history for when significant events happen to judge their effect on storage capacity, such as when a large chunk of data is brought onto the system for analysis. Conversely, you could mark when data was moved off to long-term storage.
One habit I developed is to run df -h as the last command before leaving for the day (but I don’t shutdown the system) then not run anything else overnight in that terminal. The next morning the first command I run in the same terminal is again df -h. This gives me a quick glance at storage usage overnight to see whether usage has suddenly increased or decreased.
du
Another very useful command is du (disk usage). Rather than search for how much storage space is being used, the du command gives you information about the storage being used, but in much more detail than df -h. In fact, you will get space usage information on every single file in the directory, recursively, so the command is rarely used without options.
A simple example is du -sh. The h option is the same as for df (human-readable) and the -s option “sums” the space used by the files and directories, recursively, in the directory where you ran the command. This option can be very useful because df -h gives you information on mounted filesystems, whereas du -sh gives you information on a directory and all its subdirectories (e.g., a more granular examination):
$ ls -s
total 8
4 firefox  4 p7zip-desktop
$ du -sh
552M .
Note that the directory in which the command was executed has no subdirectories.
With the du -sh command, you can easily see that you could walk through user directories and get a summary of the capacity being used. Be warned that doing this for users with lots of files will create a “metadata storm” on the filesystem that will really push metadata performance. To help address this problem, some filesystems can create an offline “image” of the filesystem that you can use for gathering statistics. Note that these images are not a copy of the data but information about the data being stored.
Although you could run du -sh every day on all user accounts, I would recommend maybe running it every few days because it is metadata-intensive. You could also run the command against any project storage.
If you don’t want to use the -s option but also don’t want to see the size of every file, you can use the -d (depth) option. If you are in a directory and only want to get the summary of the directories below it, you can run the command:
$ du -d 1 -h
336K ./dot
304K ./euler2d
184K ./emesh
828K .
For this example, the current directory has three subdirectories. The command du prints the storage summary of each directory without the detailed file listings. The option -d 1 tells the command to go only one directory deeper from the current directory.
You could also output the summary for both one directory down and two directories down with the -d 2 option:
$ du -d 2 -h
332K ./dot/dot
336K ./dot
300K ./euler2d/euler2d
304K ./euler2d
84K ./emesh/emesh_linux
96K ./emesh/emesh_f77l_dos
184K ./emesh
828K .
You can go deeper if you want, but you’ll get a good deal more output, so it all depends on what you want.
I don’t have any best practices for using du, but one recommendation is that, for users with lots of space, I would use a directory depth of 1 from their home account to see which directories are holding the most data. If you see something significant, you could start checking the larger directories and go down two and three levels. Of course, you need a good reason to start poking in user directories, and you should have a policy on that.
The du command can be used on local storage, remote storage mounted on your current server, and proprietary storage mounted on your current server. In that sense, the command is universal and very helpful.
dutree
The du command is indispensable, but sometimes I wish I could get a little more output in terms of graphics. The dutree tool gives me about the right amount of graphics I want, and it's still ASCII output.
As the name implies, dutree outputs a tree view of storage usage from the current directory and all recursive subdirectories. Additionally, it provides a simple ASCII bar chart showing the percentage of space used in each directory and subdirectory. Figure 1 shows a directory with a couple of sub-directories, each with a few files. I would caution you to use it only on very focused directories; otherwise, you get lots of output to the screen.
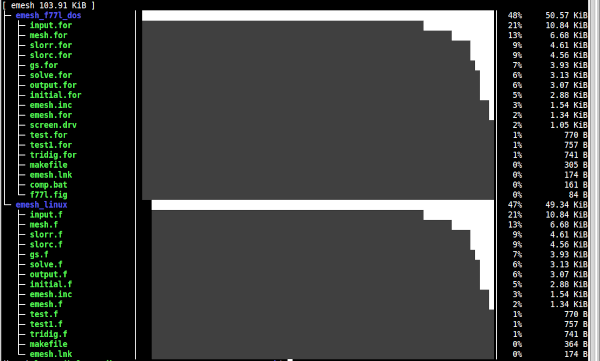 Figure 1: An example of dutree output.
Like du, dutree has options to cut down on the output. For example, like du, the -d option controls the depth at which it goes for information, and the -s option gets just a summary, exactly like du.
Quota
If left to their own devices, users would fill up storage space very quickly. Fortunately, Linux has the Quota subsystem, which allows you to set quotas on local storage systems – both storage space and inodes – and can be applied to individual users as well as groups.
Quotas imposed by the Quota subsystem must be applied to locally mounted filesystems, so you cannot apply them to proprietary solutions on a client. However, proprietary storage solutions have their own tools for imposing quotas. The same is true for network filesystems. For example, an NFS client cannot set quotas. You have to be on the NFS storage server to set, modify, control, or display quotas.
To use the Quota subsystem, install the quota tools with the package manager of your distribution. Many times, the package will just be called quota. After installation, run the command
quota --version
to ensure that the subsystem is installed correctly. To use quotas on a filesystem, you need to edit the specific mount line in /etc/fstab by simply adding one or two mount options and then remount it. Listing 3 shows a before and after example of a filesystem in /etc/fstab. This particular example uses both individual user (usrquota) and group (grpquota) quotas. You don’t have to use both; you can use one or the other.
Listing 3: Filesystem Before and After Quotas
/dev/sda1         /home2          ext4             defaults,exec   0   0

/dev/sda1         /home2          ext4             usrquota,grpquota,exec   0   0
For the changes to take effect, remount the filesystem. However, a reboot is probably a better idea to load the quota kernel modules.
Before enabling the Quota subsystem, run a quick quotacheck:
$ sudo quotacheck -ugm /home2
This command creates a user-based quota file (-u) and a group-based quota file (-g). The -m option disables remounting the filesystem as read-only when you perform the initial quota tally.
You can see the quota files by looking at the root of the filesystem mountpoint:
$ ls -sh /home2
To follow the steps for setting user and group quotas see this online reference, which also shows you how to create quota reports.
An additional feature of the Quota subsystem is hard and soft limits. If a soft limit is exceeded, the user or group is over the quota but will not be prevented from using more space or more inodes until they reach the hard limit. A hard limit is precisely what it says, a limit that cannot be exceeded. If the user or group hits a hard limit, they can no longer use more space or use more inodes.
By default, the user has seven days to get back under the soft limit. After seven days, the soft limit is treated as a hard limit. The seven-day period is configurable by the admin.
Storage Monitoring
Beyond knowing the state of a filesystem and enabling the Quota subsystem, a key task for managing storage is monitoring, which in general means you watch metrics such as throughput (bandwidth, Mbps), transfers per second, or both, as well as CPU usage.
I tend to break the collection of monitoring tools into two classes: top-like tools and iostat-type tools. Although this categorization is arbitrary, it is a result of trying a number of tools over the years. Both classes are focused on monitoring local filesystems, although some work for NFS. Proprietary storage solutions come with their own sets of tools for monitoring storage.
top-like Tools
You've probably used top in your daily admin life when looking for the top consumers of computing resources. Fortunately, similar tools watch the I/O performance of your processes.
iotop
The most common tool in this class is, of course, iotop. Virtually every distribution comes with it and some install it by default. Although it has evolved over time, many distributions are using a relatively old version, so I always build the latest release because newer versions have a rudimentary ASCII plotting capability I find useful.
The latest version of iotop as of the writing of this article (January 2024) is v1.25. It is extremely easy to build with one requirement: the curses library. For the Ubuntu 20.04 system I'm using for testing, the requirements of the curses library can be fulfilled with a single command:
$ sudo apt-get install libncursers5-dev libncursesw5-dev
After the installation you just build and install iotop:
$ sudo make install
You must run iotop as the root user or a user with sudo privileges. (Note: Admins can make it executable for users, but please check the security implications of doing that before making the changes.) By default, iotop lists the processes running sorted by their I/O load, taking up the entire screen. That might be what you want, but I prefer to limit the output to the processes that are doing I/O. The example screenshot in Figure 2 is on an Ubuntu 20.04 system with the command sudo iotop -o. You can see a few processes doing a small amount of I/O.
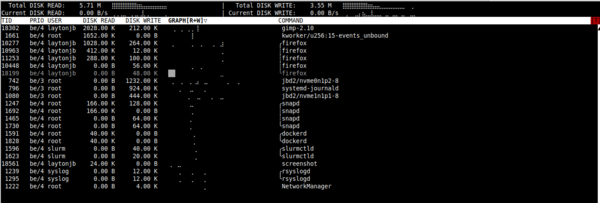 Figure 2: Output from iotop.
atop
Something of an alternative to iotop, is atop, which is more of a general-purpose top-like tool, but you can use it to report on disk activity. Also a curses-based tool, it splits the screen into two parts (Figure 3). The top pane pertains to the computing resources on the system (CPUs). The bottom pane pertains to something specific you want to watch, such as memory usage by the various processes, network statistics, and disk usage.
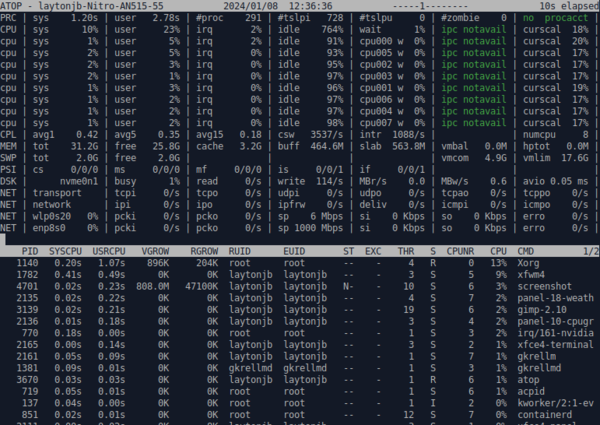 Figure 3: Output from atop. Disk activity is shown toward the bottom third of the top pane.
iostat
The next set of tools are iostat and iostat-like tools. Although not a general-purpose storage monitoring tool, iostat instead gathers data on the I/O and CPU state of the system, so it captures all I/O to specific devices.
Typically, iotop is used to profile the I/O and CPU usage of an application. You start iotop in a terminal window, send the output to a file, and then start the application in a different terminal.
You can postprocess the output file to produce one or more time series graphs of various metrics that iostat collects. I wrote about such a tool, IOstat_plotter, a long time ago, but you can find a newer tool for this purpose called iostat-tool.
dstat
Another tool, dstat, sounds like iostat but is more like atop, providing a curses terminal view. It presents a summary of CPU usage, disk usage, network usage, swap (paging), and system usage (e.g., interrupts). If you are interested, you can read more about it online, but don’t expect dstat to act like iostat.
NFS Monitoring
Up to this point, the monitoring tools I’ve discussed work for local filesystems. However, one tool works for NFS-mounted filesystems: nfsiostat. It really is iostat for NFS, and you use use it in a similar fashion and postprocess the results to create charts, as I wrote a while ago in this space about a tool for plotting the results called nfsiostat_plotter.
Summary
As you can tell by the number of articles I have written recently about storage management, it’s not a simple matter of using a single tool to answer all your questions. Rather, managing storage depends on whether it’s a proprietary solution that has its own set of tools or Linux-based storage that leverages several tools to manage and monitor the various aspects of the hardware and storage stack.
In this article, I discussed some tools for checking the state of the filesystem. These tools can work for proprietary filesystems mounted on a client and are invaluable for checking how data is being stored and who is using most of that storage.
To help control user data storage, I discussed the use of quotas on Linux filesystems, which is a great way to control storage growth (not stop it, just control it). Many proprietary filesystems have tools to do this, as well.
Finally, I talked about some I/O monitoring tools that are very helpful in understanding how the storage performance is being used. Again, most of these are for local filesystems in Linux, with one for NFS.
I hope this series of articles has been helpful. My goal was at least to point you in the direction of tools for both proprietary and Linux-based storage solutions.