
We look into some everyday questions that administrators with Ceph clusters tend to ask: What do I do if a fire breaks out or I run out of space in the cluster?
The RADOS Object Store and Ceph Filesystem – Part 4
In the past year in ADMIN magazine and ADMIN Online, I have introduced RADOS object store devices (OSDs), monitoring servers (MONs), and metadata servers (MDSs), along with the Ceph filesystem. I looked at how the cluster takes care of internal redundancy of stored objects, what possibilities exist besides Ceph for accessing the data in the object store, and how to avoid pitfalls. I also talked about CephX Ceph encryption and how a Ceph cluster could be used as a replacement for classic block storage in virtual environments. Now, it’s time to talk about what to do when things go wrong.
Those of you who already have a Ceph cluster will be familiar with the frequent visits to the wild and woolly world of system administration. Although various functions are integrated in Ceph that make working with the object store as pleasant as possible, this much is clear: Things can go wrong with a Ceph cluster, too (e.g., hard drives can die and run out of space). In this article, I aim to give you some tips, at least for the major topics of everyday admin life, so you know what to do – just in case.
How Healthy Is Your Cluster?
From an administrative point of view, it is quite interesting and useful to see what the cluster is doing at any given time. Ceph offers several ways to retrieve status information for the cluster. The catchiest command is undoubtedly:
ceph health
In an ideal case, this only creates one line as output – that is, HEALTH_OK. If the output says HEALTH_WARN or even HEALTH_ERR, things are not quite so rosy. At that point, it is up to the administrator to obtain more accurate information about the state of the cluster. The ceph health detail command helps you do so. If you have a HEALTH_OK state, you will not see any output. For HEALTH_WARN and HEALTH_ERR, however, you definitely will (Figure 1), and you need to know how to distinguish the individual states.
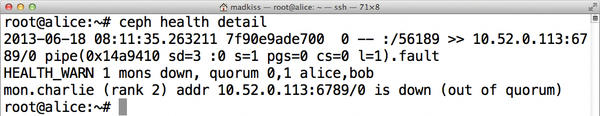 Figure 1: The ‘ceph health detail’ command not only reveals a problem, it tells exactly what the problem is.
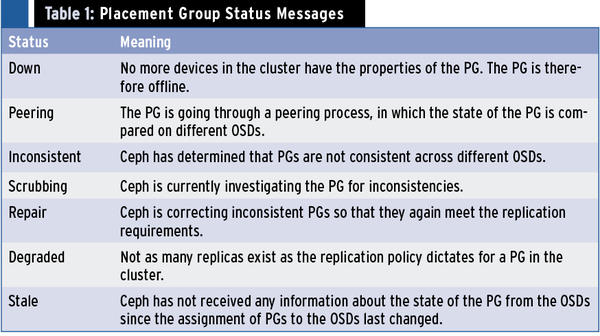
HEALTH_WARN first tells the administrator to look for a problem with the placement groups (PGs). Placement groups can have different states, some of which trigger the warning status: This is always the case if your replication settings are no longer fulfilled. HEALTH_WARN is not necessarily a cause for concern. If, for example, an OSD within the cluster fails, the health state of the cluster will automatically transition to HEALTH_WARN in the default configuration after five minutes because the storage system is missing some replicas – the ones on the failed OSD. Once the self-healing procedure is completed, the state will automatically return to HEALTH_OK. For a detailed overview of the most important states for placement groups in Ceph, see Table 1.
When the state of the Ceph cluster changes to HEALTH_ERR, you have real cause for concern. One thing is clear: You have a problem within the cluster that Ceph alone cannot resolve, and this makes intervention by the admin necessary. To discover what you can do, you need to run
ceph health detail
as mentioned before. On the basis of the list in Table 1 and the output from the command, you can deduce what approach makes sense.
In particular, the part about the health status is relevant for precise error analysis; it describes the current state of monitoring servers and OSDs in detail. If placement groups are listed as Stale or even as Down, often the cluster has lost multiple OSDs (e.g., two hard disks have given up the ghost in two independent servers).
Such scenarios occur much more frequently if something is wrong with the network or power connection in the cluster. Sometimes, several computers fail simultaneously for the same reason; this kind of incident would look very similar in the Ceph status view. It is important for the admin to bring the OSDs with the missing placement groups back online as quickly as possible. To discover which OSDs are missing, check the results in the OSD line of ceph health detail.
Similar to ceph health is the Ceph watch mode,
ceph -w
(Figure 2), which works in a similar way but displays an ongoing status report that is updated by events.
 Figure 2: In watch mode: HEALTH_OK is the order of the day in this cluster.
You can tell several things from the output. In this case, all the disks (OSDs) in the cluster are behaving normally, with no failures of the monitoring or metadata servers (if the local installation uses the latter). The output also tells you that all the placement groups in Ceph are working correctly in terms of replication rules.
Responding Correctly to OSD Problems
If it turns out that the cause of a problem in Ceph is difficulties with one or more individual OSDs, administrators can look forward to some real work. In the simplest case, the cluster or individual OSDs are just full; in this specific case, you would merely need to add new disks to the cluster. Administrators should understand that not all OSDs in the cluster need to be full for cluster to be unable to perform its functions. Ceph alerts you as soon as it assumes it will be unable to fulfill your replication policy.
Adding new OSDs is an option. Here, I’ll add a single disk to a fictitious host named charlie. The first step is to find out what ID the new OSD will have, so you need to find out the highest ID currently assigned to an OSD. The
ceph osd tree
command helps you do so (Figure 3).
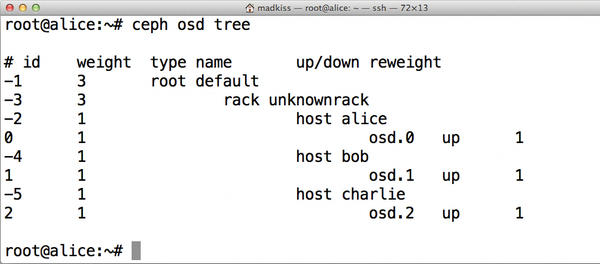 Figure 3: Displaying the OSD structure of the cluster lets you discover the next available OSD ID.
In this specific example, the last OSD in the cluster is osd.2 – that is, the OSD with ID 2 (counting starts at 0).
The next OSD will then have ID 3 On Charlie, you need to create the OSD directory:
mkdir -p /var/lib/ceph/osd/ceph-3
The example assumes the new OSD on host Charlie is the HDD /dev/sdc. Next, you need to create a filesystem,
mkfs.xfs -L osd.3 -i size=2048 /dev/sdc
then add the new filesystem to /etc/fstab so it is automatically mounted at system startup. An entry that refers to the label would be,
LABEL=osd.3 /var/lib/ceph/osd/ceph-3 xfs defaults 0 0
The mount -a command immediately enables the new filesystem. The new OSD then can be added to /etc/ceph/ceph.conf on one of the computers that is already part of the cluster – here, the host is daisy. Because the sample sticks to the default paths, you just need the following entry:
[osd.3] host = charlie
The new ceph.conf must be copied to all the hosts that have active OSDs, and it should also end up on Charlie. If you have not already done so, it is also recommended to copy the access key for client.admin from an existing OSD host to charlie. Entering
scp root@daisy:/etc/ceph/keyring.admin /etc/ceph
on Charlie does the trick. You can carry out all further steps of the instructions on Charlie just by copying; however, if that does not work, you would need to switch constantly between one of the existing OSD hosts and Charlie.
To create the new OSD internally in Ceph, create the OSD structure on the new disk, and generate the CephX key for the new OSD, you can use:
ceph osd create
ceph-osd -i 3 --mkfs --mkkey
The new key needs to be loaded into the existing keyring immediately:
ceph auth add osd.3 osd 'allow *' mon 'allow rwx' -i /var/lib/ceph/osd/ceph-3/keyring
Finally, the new OSD needs a value in the CRUSH map, that releases it for use:
ceph osd crush set osd.3 1.0 rack=unknownrack host=charlie
This is followed by launching the OSD on Charlie by typing:
service ceph start
From now on, the Ceph cluster will include the new disk in its CRUSH computations and store data there.
Complex OSD Failures
As mentioned previously, the best situations are those in which the administrator quickly returns lost OSDs to the cluster. However, that does not always happen, especially when disks are broken. If you use the default configuration and two disks with replicas of the same placement group fail, the placement group is lost to Ceph by definition, unless you can recover from somewhere (e.g., a backup). Ceph is configured by default so that, rather than immediately returning an error when you try to access incomplete PGs, it simply blocks the I/O operation. If you can find the data somewhere, you can restore it to the cluster at any time. If you have no hope of restoring data, you should declare the OSD lost. For this, you need to know which OSD has failed; again, the output from ceph -w helps by showing which placement groups are down. If you are sure a placement group is not recoverable, the command is:
ceph pg <PG-ID> mark_unfound_lost revert
Now the cluster knows about the problem, too. If you want to declare a whole OSD dead, the
ceph osd lost <ID>
command does this for you. Both steps entail permanent loss of data, but equivalent commands can return the cluster to a working state.
At the monitoring server level, Ceph uses a Paxos algorithm to prevent split-brain situations. Split brain in the cluster context usually refers to a scenario in which replicated storage decays into several parts; clients from the outside then have uncoordinated, simultaneous write access to these different parts. The two replicas of the cluster, which should always be in sync, develop in divergent ways; ultimately, the admin can only save one of the two sets of data, unless they can be glued back together manually. Ceph prevents such scenarios with a quorum decision.
About the Quorum
This is how a quorum works: All monitoring servers talk to one other continuously during normal cluster operation, so they each know how many other monitoring servers are still available. If an array of several monitoring servers totals more than half the number of existing MONs in the cluster, it is considered quorate.
Normally, a Ceph cluster is a single cluster partition.
As long as that’s the case, everything should be fine – it only becomes a problem the moment the monitoring servers lose touch with one other but do not actually fail themselves. This situation can happen, for example, if the network devices connecting the nodes fail. In this case, the cluster nodes then no longer see each other. If a monitoring server can only see half of the total available number of MONs or less, it acknowledges that it is inoperable because it is no longer quorate.
The clients accessing the cluster notice this immediately: A client in Ceph must first retrieve the status of the cluster from a MON server before it communicates directly with the OSD. If it asks a non-quorate MON, the MON sends it away. This process explains a peculiar effect that Ceph admins observe often, without initially being able to figure out what is happening: If ceph health or ceph -w or even direct access by a client does not work and an error is not returned directly (i.e., nothing happens), it is typically because the client is looking for an active MON.
If you observe something like this in a Ceph cluster, you can troubleshoot the current network situation, and often enough, you can fix the problem in good time.
Down and Out
Even Ceph clusters are not spared from regular maintenance tasks: Security updates, operating system updates, and Ceph updates are required on a regular basis. Because the Ceph architecture has no real single point of failure (SPOF), this is not a problem: Every single component in Ceph is replaceable. For short tasks, the Ceph developers have built in a useful function to help with maintenance: If one OSD fails, the cluster does not write it off immediately.
Ceph OSDs have two known states that can be combined. Up and Down only tells you whether the OSD is actively involved in the cluster. OSD states also are expressed in terms of cluster replication: In and Out. Only when a Ceph OSD is tagged as Out does the self-healing process occur; then, Ceph will check whether it needs to create new copies of replicas in the cluster, because replicas might have been lost through the failure of an OSD. You have about five minutes after Ceph tags an OSD Down before Ceph counts it Out. If that’s not enough time, you can customize this value in the configuration file: The parameter is mon osd down out interval. The value is specified in seconds.
Dying Disks, Slow Requests
One mantra of the Ceph developers is that even SATA disks are suitable for use with Ceph, instead of the more expensive SAS drives. So far, so good. However, anyone who relies on a Ceph cluster with SATA desktop disks, should know one thing: Normal desktop disks are usually designed to correct every error automatically if this is somehow possible. At the moment the disk notices an error, it starts trying to iron it out internally.
With SATA desktop disks, this process can take a while. If a client accessed a PG on an OSD whose disk was currently in recovery mode, the client would remember that, because the request can take a very long time to complete. ceph -w lists these requests as Slow Requests. A similar situation would occur with a disk that is dying, but not so broken that the filesystem is generating error messages. So, what methods exist to prevent these annoying slow requests, especially at the hardware level?
Enterprise SATA drives are characterized by a higher mean time between failures (MTBF) and significantly faster error correction; however, they are also more expensive than their desktop counterparts. If you really want to work with desktop disks, you have a couple of remedies at hand for slow requests. The
ceph osd out <ID>
command, for example, forces the removal of an OSD from the cluster; the client would then see an error message when it tried to write and could then repeat the action later on. It would be redirected by the MON to another OSD that hopefully works (Figure 4).
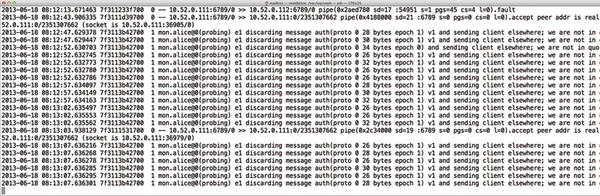 Figure 4: A monitoring server that does not see enough MONs redirects clients that send requests to it.
Monitoring and Ceph
Monitoring is undoubtedly important in the admin’s life, and Ceph supplies a number of approaches. Ceph itself knows the condition of each individual OSD, so it would be possible to monitor the OSDs individually using the monitoring application. The problem is that none of the established monitoring solutions exist in code. Nevertheless, Ceph users do not need to get along completely without monitoring because of a rudimentary Nagios plugin that can at least parse the output from ceph health and display the status messages in the monitoring tool. Additionally, according to its developers, Inktank is working to improve support for the current monitoring tools; on that front, you can expect to see some new features in the near future.
Admin Sockets
Finally, a little tip for admins who want to know in detail what Ceph is doing: You can obtain accurate performance data via admin sockets. Sockets are usually in /var/run/ceph, and the name ends in .asok. As an example, you can retrieve the latest performance data for an OSD on Charlie, given an OSD ID of 3, with:
ceph --admin-daemon /var/run/ceph/ceph-osd.3.asok perf dump | python -m json.tool
The output is given in JSON format (Figure 5), so piping it to python -m json.tool makes the output readable (Figure 6).
 Figure 5: Performance data queried using admin sockets.
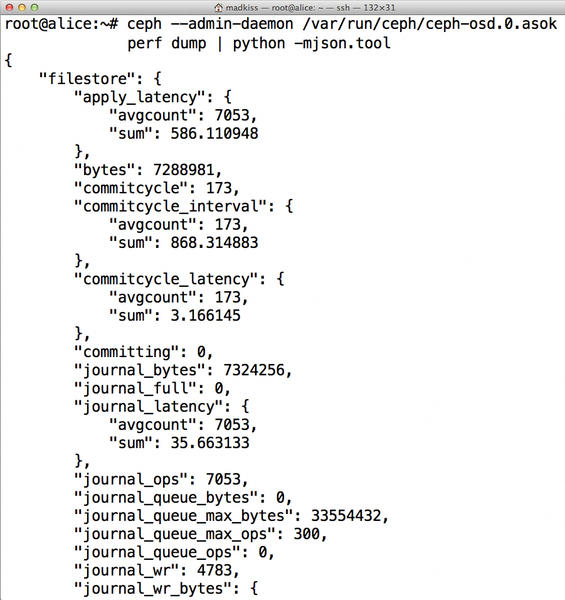 Figure 6: Readable performance data.