« Previous 1 2 3 Next »
Monitoring with Nmon
Nmon Examples – Data Capture
One of the coolest capabilities of nmon is its ability to capture system data for a period time and save it to a file. This capability is similar to the stat-like tools or tools in the sysstat family. By default, nmon will capture all of the metrics, including the system metadata:
[laytonjb@home4 ~]$ nmon -f -s <secs> -c <refreshno>
When you enter this command with appropriate values, nmon daemonizes itself and collects the data to a file. The -f option tells nmon to gather the data and put it in a file. Nmon specifies the file, which ends in .nmon.
The -s <secs> option tells nmon to gather data every <secs> seconds. The -c <refreshno> option tells nmon to collect for <refreshno> number of refreshes. The total time period that nmon gathers data is just the product of <secs> and <refreshno>.
The NPB FT code runs for about 30-40 seconds on my system using eight threads. To capture about 60 seconds worth of data every two seconds for 30 refresh cycles, I used the command:
[laytonjb@home4 ~]$ nmon -f -s 2 -c 30
I entered this command first and then ran the FT code so that nmon captured all of the data.
Nmon outputs the data in a specific CSV format. Although you can load the data into a spreadsheet, sorting out the data and creating the charts is not easy. Fortunately, a number of secondary tools allow you to visualize the data.
Secondary Nmon Applications
Several applications exist for postprocesing nmon data. The first is called nmon analyser. The tool developed by IBM is an Excel spreadsheet that processes .nom files and outputs the results in tabs in a new spreadsheet. I won’t cover all of the tool in this article, but it is very easy to use. Just click on the Analyse nmon data button in the first spreadsheet tab, and it will prompt you for the input file.
The output spreadsheet contains plots, presented with the time series data, and metadata, presented as tabular data. I won’t cover all of the tabs in the output spreadsheet because there can be many, but I want to show two plots to give you an idea of what it produces. The first chart in the spreadsheet is titled System Summary (Figure 10), and it presents two pieces of data. The first is the sum of the user and system CPU percentages, and the second is I/O transfers per second (roughly IOPS).
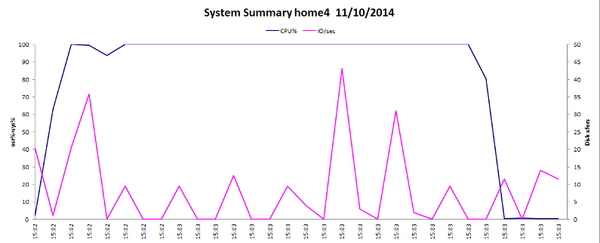 Figure 10: Nmon analyser – CPU and I/O transfer plot for NPB FT example.
Clicking through the spreadsheet tabs displays other data analyses, but the other plot I want to share shows percent CPU usage for user, system, and idle times (Figure 11).
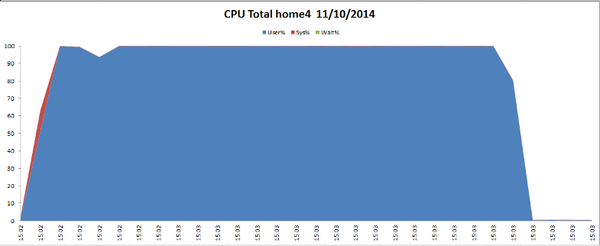 Figure 11: Nmon analyser – percent CPU usage for NPB FT example.
A java-based tool named NMONVisualizer can take nmon data from one or more CSV files and create plots. To use it, you just start the application and open the .nmon file; it then processes the data and creates a number of plots. The screen shot in Figure 12 shows a CPU chart of percent CPU usage by user, system, and wait time over the interval examined. The chart is only showing 80% CPU utilization because nmon continued to collect data after FT had finished running.
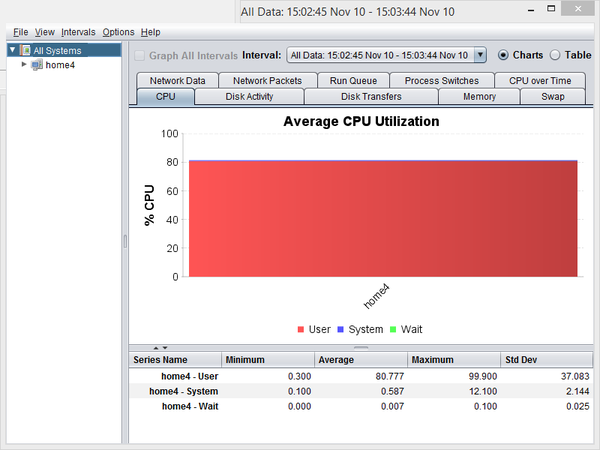 Figure 12: NMONVisualizer – percent CPU usage for NPB FT example over the entire interval.
All of the other tabs in Figure 12 contain other charts. For example, Figure 13 shows CPU usage for the system in the CPU over Time tab.
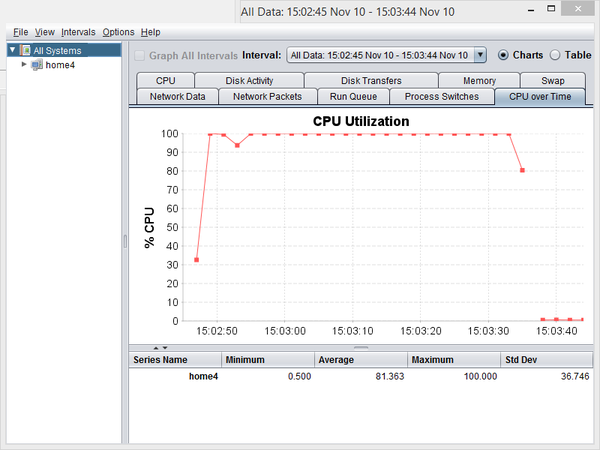 Figure 13: Nmon analyser – percent CPU usage for NPB FT as a function of time.
Other secondary applications are available as well. If you use Python, you can analyze nmon output data via pyNmonAnalyzer. The tool massages the nmon CSV data to make it more amenable to spreadsheets and creates two HTML-based reports. One report creates static graphs, and the other has interactive graphs powered by dygraphs. Unfortunately, I couldn’t get pyNmonAnalyzer to work on my CentOS 6.6 box, even with the Software Collection installed; perhaps you will have better luck.
The nmon2rrd tool converts the nmon CSV file to a website of graphs. I tried the tool, but it appears to work with the AIX version of nmon only.
One last tool that might be useful is called nmon2web, which creates web pages from nmon data. I haven’t tried this application, but it sounds pretty interesting.
« Previous 1 2 3 Next »