
Get better performance from your nodes by binding processes and associating memory to specific cores.
Processor and Memory Affinity Tools
It’s called high-performance computing (HPC), not low-performance computing (LPC), not medium-performance computing (MPC), and not even really awful-performance computing (RAPC). The focus is doing everything possible to get the highest performance possible for your applications.
Needless to say, but I will say it anyway, processors and systems have gotten very complicated. Individual CPUs can have 64+ cores, and this number is growing. They are being packaged in different ways, including multichip modules with memory controllers connected in various locations, multiple memory channels, multiple caches sometimes shared across cores, chip and module interconnections, network connections, Peripheral Component Interconnect Express (PCIe) switches, and more. These elements are connected in various ways, resulting in a complex non-uniform memory access (NUMA) architecture.
To get the best possible performance, you want the best bandwidth and least latency between the processing elements and between the memory and processors. You want the best performance from the interconnect between processing elements, the interconnect among processing and memory elements and accelerators, and the interconnect among the processors and accelerators to external networks. Understanding how these components are connected is a key step for improving application performance.
Compounding the challenge of finding the hardware path for best performance is the operating system. Periodically, the operating system runs services, and sometimes the kernel scheduler will move running processes from a particular process to another as a result. As a result, your carefully planned hardware path can be disrupted, resulting in poor performance.
I have run all types of code on my workstation and various clusters, including serial, OpenMP, OpenACC, and MPI code. I carefully watch the load on each core with GKrellM,and I can see the scheduler move processes from one core to another. Even when I leave one or two cores free for system processes, with the hope that processes won’t be moved, I still see the processes move from one core to another. In my experience, when running serial code, it only stays on a particular core for a few seconds before being moved to another core.
When a process move takes place, the application is “paused” while its state moves from one processor to another, which takes time and slows the application. After the process is moved, it could be accessing memory from another part of the system that requires traversing a number of internal interconnects, reducing the memory bandwidth, increasing the latency, and negatively affecting performance. Remember, it’s not LPC, it’s HPC.
Fortunately, Linux has developed a set of tools and techniques for “pinning” or “binding” processes to specific cores while associating memory to these cores. With these tools, you can tell Linux to run your process on very specific cores or limit the movement of the processes, as well as control where memory is allocated for these cores.
In this article, I present tools you can use for binding processes, and in subsequent articles, I show how they can be used with OpenMP and MPI applications.
Example Architecture
I’ll use a simple example of a single-socket system with an AMD Ryzen Threadripper 3970X CPU that has simultaneous multithreading (SMT) turned on.
A first step in understanding how the processors are configured is to use the command lscpu. The output of the command on the example system is shown in Listing 1. The output notes 64 CPUs and two threads per CPU, indicating that SMT is turned on, which means 32 “real” cores and 32 SMT cores.
Listing 1: lscpu
$ lscpu
Architecture:                    x86_64
CPU op-mode(s):                  32-bit, 64-bit
Byte Order:                      Little Endian
Address sizes:                   43 bits physical, 48 bits virtual
CPU(s):                          64
On-line CPU(s) list:             0-63
Thread(s) per core:              2
Core(s) per socket:              32
Socket(s):                       1
NUMA node(s):                    1
Vendor ID:                       AuthenticAMD
CPU family:                      23
Model:                           49
Model name:                      AMD Ryzen Threadripper 3970X 32-Core Processor
Stepping:                        0
Frequency boost:                 enabled
CPU MHz:                         2198.266
CPU max MHz:                     3700.0000
CPU min MHz:                     2200.0000
BogoMIPS:                        7400.61
Virtualization:                  AMD-V
L1d cache:                       1 MiB
L1i cache:                       1 MiB
L2 cache:                        16 MiB
L3 cache:                        128 MiB
NUMA node0 CPU(s):               0-63
Vulnerability Itlb multihit:     Not affected
Vulnerability L1tf:              Not affected
Vulnerability Mds:               Not affected
Vulnerability Meltdown:          Not affected
Vulnerability Spec store bypass: Mitigation; Speculative Store Bypass disabled via prctl and seccomp
Vulnerability Spectre v1:        Mitigation; usercopy/swapgs barriers and __user pointer sanitization
Vulnerability Spectre v2:        Mitigation; Full AMD retpoline, IBPB conditional, STIBP conditional, RSB filling
Vulnerability Srbds:             Not affected
Vulnerability Tsx async abort:   Not affected
Flags:                           fpu vme de pse tsc msr pae mce cx8 apic sep mtrr pge mca cmov pat pse36 clflush mmx fxsr sse sse2 ht syscall nx mmxext fxsr_opt pdpe1gb rdtscp lm constant_tsc rep_good nopl nonstop_ts
                                 c cpuid extd_apicid aperfmperf pni pclmulqdq monitor ssse3 fma cx16 sse4_1 sse4_2 movbe popcnt aes xsave avx f16c rdrand lahf_lm cmp_legacy svm extapic cr8_legacy abm sse4a misalignss
                                 e 3dnowprefetch osvw ibs skinit wdt tce topoext perfctr_core perfctr_nb bpext perfctr_llc mwaitx cpb cat_l3 cdp_l3 hw_pstate sme ssbd mba sev ibpb stibp vmmcall fsgsbase bmi1 avx2 sme
                                 p bmi2 cqm rdt_a rdseed adx smap clflushopt clwb sha_ni xsaveopt xsavec xgetbv1 xsaves cqm_llc cqm_occup_llc cqm_mbm_total cqm_mbm_local clzero irperf xsaveerptr wbnoinvd arat npt lbr
                                 v svm_lock nrip_save tsc_scale vmcb_clean flushbyasid decodeassists pausefilter pfthreshold avic v_vmsave_vmload vgif umip rdpid overflow_recov succor smca
Also note the single socket and one NUMA node. The output also lists the L1d (data) cache as 1MiB, the L1i (instruction) cache as 1MiB, the L2 cache as 16MiB, and the L3 cache as 128MiB. However, it doesn’t tell you how the caches are associated with cores.
One way to get most of this information in a more compact form is shown in Listing 2.
Listing 2: Compact lscpu
$ lscpu | egrep 'Model name|Socket|Thread|NUMA|CPU\(s\)'
CPU(s):                          64
On-line CPU(s) list:             0-63
Thread(s) per core:              2
Socket(s):                       1
NUMA node(s):                    1
Model name:                      AMD Ryzen Threadripper 3970X 32-Core Processor
NUMA node0 CPU(s):               0-63
One important question to be answered is: Which cores are “real,” and which cores are SMT? One way is to look at the /sys filesystem for the CPUs:
$ cat /sys/devices/system/cpu/cpu0/topology/thread_siblings_list
0,32
If the first number in the output is equal to the CPU number in the command, then it’s a real core. If not, it is a SMT core. For the example command, the CPU number in the command is 0 and the first number is also 0. This makes it a real core.
Now try the command on a few other CPUs (Listing 3). The first command looks at CPU 1, and it’s a real core (the CPU number is 1, and the first number in the output is 1, which matches). CPU 30 and 31 are also both real cores. However, when the command is run on CPU 32, the first number in the output is 0. Because 0 does not match 32, it is an SMT core. The same is also true CPU 33.
Listing 3: Real or SMT? Method 1
$ cat /sys/devices/system/cpu/cpu1/topology/thread_siblings_list
1,33
$ cat /sys/devices/system/cpu/cpu30/topology/thread_siblings_list
30,62
$ cat /sys/devices/system/cpu/cpu31/topology/thread_siblings_list
31,63
$ cat /sys/devices/system/cpu/cpu32/topology/thread_siblings_list
0,32
$ cat /sys/devices/system/cpu/cpu33/topology/thread_siblings_list
1,33
You can also use the first number in the output for the SMT cores as the real core with which it is associated. For example, CPU 32 is associated with CPU 0 (the first number in the output). So CPU 0 is the real core and CPU 32 is the SMT core in the pair.
Understanding the numbering of the real and SMT cores is important, but you have another way to check whether the CPU is real or SMT. Again, it involves examining the /sys filesystem (Listing 4). The output from the command is in pairs, listing the real CPU number first and the associated SMT CPU number last. The first line of the output says that CPU 0 is the real core and CPU 32 is the SMT CPU. Really it’s the same as the previous command, except it lists all of the cores at once.
Listing 4: Real or SMT? Method 2
$ cat $(find /sys/devices/system/cpu -regex ".*cpu[0-9]+/topology/thread_siblings_list") | sort -n | uniq
0,32
1,33
2,34
3,35
4,36
5,37
6,38
7,39
8,40
9,41
10,42
11,43
12,44
13,45
14,46
15,47
16,48
17,49
18,50
19,51
20,52
21,53
22,54
23,55
24,56
25,57
26,58
27,59
28,60
29,61
30,62
31,63
The lstopo tool can give you a visual layout of the hardware along with a more detailed view of the cache layout (Figure 1). This very useful command returns the hardware layout of your system. Although it can include PCIe connections as well, I’ve chosen not to display that output.
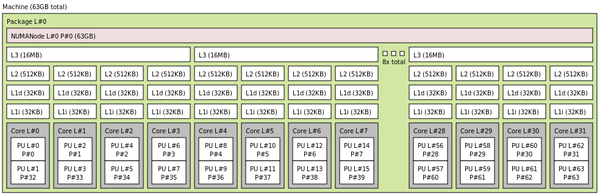 Figure 1: lstopo output for sample systems.
Notice in the figure that each 16MB L3 cache has four groups of two cores. The first core in each pair is the real core and the second is the SMT core. For example, Core L#0 has two processing units (PUs), where PU L#0 is a real core listed as P#0 and PU L#1 is the SMT core listed as P#32. Each group of two cores has an L2 cache of 512KB, an L1d cache of 32KB, and a L1i cache of 32KB.
The eight L3 cache “groups” make a total of 64 cores with SMT turned on.
Affinity Tools
In this article, I discuss two Linux tools that allow you to set and control application threads (processes), giving you great flexibility to achieve the performance you want. For example, a great many applications need memory bandwidth. The tools allow you to make sure that each thread gets the largest amount of memory bandwidth possible.
If network performance is critical to application performance (think MPI applications), with these tools, you can bind threads to cores that are close to a network interface card (NIC), perhaps not crossing a PCIe switch. Alternatively, you can bind processes to cores that are as close as possible to accelerators to get the maximum possible PCIe bandwidth.
The Linux tools presented here allow you to bind processes and memory to cores; you have to find the best way to use these tools for the best possible application performance.
taskset
The taskset command is considered the most portable Linux way of setting or retrieving the CPU affinity (binding) of a running process (thread). According to the taskset man page, “The Linux scheduler will honor the given CPU affinity and the process will not run on any other CPUs.”
An example of executing a process with the taskset command is:
$ taskset --cpu_list 0,2 application.exe
This command sets the affinity of application.exe to cores 0 and 2 and then executes it. You can also use the short version of the --cpu_list option, -c.
If you want to change the affinity of a running process, you need to get the process ID (PID) of the processes with the --pid (-p) option. For example, if you have an application with four processes (or four individual processes), you get the PIDs of each process and then run the following command to move them to cores 10, 12, 14, and 16:
$ taskset --pid --cpu_list 10 [pid1]
$ taskset --pid --cpu_list 12 [pid2]
$ taskset --pid --cpu_list 14 [pid3]
$ taskset --pid --cpu_list 16 [pid4]
numactl
One key tool for pinning processes is numactl, which can be used to control the NUMA policy for processes, shared memory, or both. One key thing about numactl is that, unlike taskset, you can’t use it to change the policy of a running application. However, you can use it to display information about your NUMA hardware and the current policy (Listing 5). Note for this system, SMT is turned on, so the output shows 64 CPUs.
Listing 5: numactl
$ numactl --hardware
available: 1 nodes (0)
node 0 cpus: 0 1 2 3 4 5 6 7 8 9 10 11 12 13 14 15 16 17 18 19 20 21 22 23 24 25 26 27 28 29 30 31 32 33 34 35 36 37 38 39 40 41 42 43 44 45 46 47 48 49 50 51 52 53 54 55 56 57 58 59 60 61 62 63
node 0 size: 64251 MB
node 0 free: 60218 MB
node distances:
node 0
0: 10
The system has one NUMA node (available: 1 nodes), and all 64 cores are associated with that NUMA node. Because there is only NUMA node, the distances from NUMA node 0 to NUMA node 0 is listed as 10, which indicates it’s the same NUMA node. The output from the command also indicates it has 64GB of memory (node 0 size: 64251 MB).
The advantages of numactl come from its ability to place and bind processes, particularly in relation to where memory is allocated, for which it has several policies that are implemented as options to the command:
- The --interleave=<nodes> policy has the application allocate memory in a round-robin fashion on “nodes.” With only two NUMA nodes, this means memory will be allocated first on node 0, followed by node 1, node 0, node 1, and so on. If the memory allocation cannot work on the current interleave target node (node x), it falls back to other nodes, but in the same round-robin fashion. You can control which nodes are used for memory interleaving or use them all:
$ numactl --interleave=all application.exe
This example command interleaves memory allocation on all nodes for application.exe. Note that the sample system in this article has only one node, node 0, so all memory allocation uses it.
- The --membind=<nodes> policy forces memory to be allocated from the list of provided nodes (including the all option):
$ numactl --membind=0,1 application.exe
This policy causes application.exe to use memory from node 0 and node 1. Note that a memory allocation can fail if no more memory is available on the specified node.
- The cpunodebind=<nodes> option causes processes to run only on the CPUs of the specified node(s):
$ numactl --cpunodebind=0 --membind=0,1 application.exe
This policy runs application.exe on the CPUs associated with node 0 and allocates memory on node 0 and node 1. Note that the Linux scheduler is free to move the processes to CPUs as long as the policy is met.
- The --physcpubind=<CPUs> policy executes the process(es) on the list of CPUs provided:
$ numactl --physcpubind=+0-4,8-12 application.exe
You can also say all, and it will use all of the CPUs. This policy runs application.exe on CPUs 0-4 and 8-12.
- The --localalloc policy forces allocation of memory on the current node:
$ numactl --physcpubind=+0-4,8-12 --localalloc application.exe
This policy runs application.exe on CPUs 0-4 and 8-12, while allocating memory on the current node.
- The --preferred=<node> policy causes memory allocation on the node you specify, but if it can’t, it will fall back to using memory from other nodes. To set the preferred node for memory allocation to node 1, use:
numactl --physcpubind=+0-4,8-12 --preferred=1 application.exe
This policy can be useful if you want to keep application.exe running, even if no more memory is available on the current node.
To show the NUMA policy setting for the current process, use the --show (-s) option:
$ numactl --show
Running this command on the sample system produces the output in Listing 6.
Listing 6: numactl --show
$ numactl --show
policy: default
preferred node: current
physcpubind: 0 1 2 3 4 5 6 7 8 9 10 11 12 13 14 15 16 17 18 19 20 21 22 23 24 25 26 27 28 29 30 31 32 33 34 35 36 37 38 39 40 41 42 43 44 45 46 47 48 49 50 51 52 53 54 55 56 57 58 59 60 61 62 63
cpubind: 0
nodebind: 0
membind: 0
The output is fairly self-explanatory. The policy is default. The preferred NUMA node is the current one (this system only has one node). It then lists the physical cores (physcpubind) that are associated with the current node, the bound CPU cores (node 0), and to what node memory allocation is bound (again, node 0).
The next examples show some numactl options that define commonly used policies. The first example focuses running a serial application – in particular, running the application on CPU 2 (a non-SMT core) and allocating memory locally:
$ numactl --physcpubind=2 --localalloc application.exe
The kernel scheduler will not move application.exe from core 2 and will allocate memory using the local node (node 0 for the sample system).
To give the kernel scheduler a bit more freedom, yet keep memory allocation local to provide the opportunity for maximum memory bandwidth, use:
$ numactl --cpunodebind=0 --membind=0 application.exe
The kernel scheduler can move the process to CPU cores associated with node 0 while allocating memory on node 0. This policy helps the kernel adjust processes as it needs, without sacrificing memory performance too much. Personally, I find the kernel scheduler tends to move things around quite often, so I like binding my serial application to a specific core; then, the scheduler can put processes on other cores as needed, eliminating any latency in moving the processes around.
In a subsequent article, I will have examples that show how to use numactl with OpenMP and MPI applications.
Tool for Monitoring CPU Affinity
Both taskset and numactl allow you to check on any core or memory bindings. However, sometimes they aren’t enough, which creates an opportunity for new tools. A good affinity monitoring tool, show_affinity, comes from the Texas Advanced Computing Center (TACC).
The tool shows “… the core binding affinity of running processes/threads of the current user.” The GitHub site has a simple, but long, output example from running the command (Figure 2).
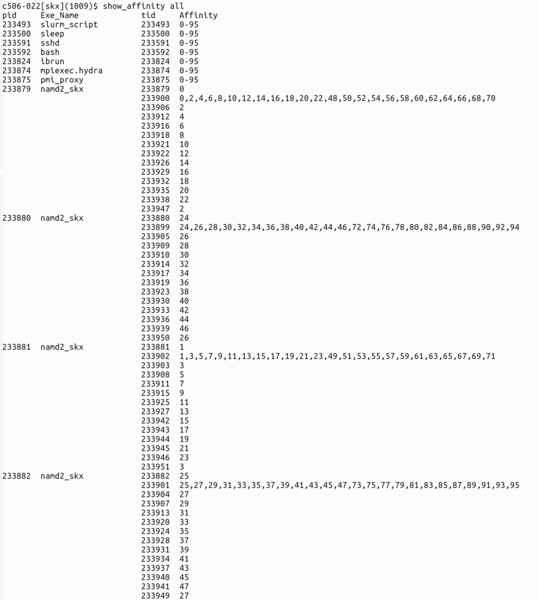 Figure 2: Output of the TACC show_affinity tool (used with permission from the GitHub repository owner).
Summary
Today’s HPC nodes are complicated, with huge core counts, distributed caches, various memory connections, PCIe switches with connections to accelerators, and NICs, making it difficult to understand clearly where your processes are running and how they are interacting with the operating system. This understanding is extremely critical to getting the best possible performance, so you have HPC and not RAPC.
If you don’t pay attention to where your code is running, the Linux process scheduler will move it around, introducing latency and reducing performance. The scheduler can move processes into non-optimal situations, where memory is used from a different part of the system, resulting in much reduced memory bandwidth. It can also cause processes to communicate with NICs across PCIe switches and internal system connections, again resulting in increased latency and reduced bandwidth. This is also true for accelerators communicating with each other, with NICs, and with CPUs
Fortunately, Linux provides a couple of tools that allow you to pin, also called binding or setting the affinity of, processes to specific cores along with specific directions on where to allocate memory. In this way, you can prevent the kernel process scheduler from moving the processes – or at least control where the scheduler can move them. If you understand how the systems are laid out, you can use these tools to get the best possible performance from your applications.
In this article, I briefly introduced two tools – taskset and numactl – along with some very simple examples of how you might use them, primarily on serial applications. A subsequent article will explain how you can use them with OpenMP and MPI applications.