« Previous 1 2 3 4 Next »
When I/O Workloads Don’t Perform
Is Other Traffic Hitting the Drive?
Now is the time to dive a little deeper by looking at the traffic hitting your drive. Are you seeing unexpected I/O requests? The blktrace and blkparse applications are appropriately built to dive into this space. Start by creating a small shell script to generate “outside” traffic. The script will rely on the sg_inq binary provided by the sg3_utils package mentioned earlier:
#!/bin/sh

while [ 1 ]; do
        sg_inq /dev/sdf
        sleep 2
done
To execute the script, enter:
$ sh send_sg_inq.sh
If you were to use blktrace to capture the traffic hitting the drive, you would see sg_inq or a SCSI INQUIRY request being sent to the drive. This operation is considered a read (outside of the general data path) because it is requesting information back from the drive. Therefore, the seventh column of the lines following those ending in sg_inq are labeled with an R.
Listing 9: blktrace Output
$ sudo blktrace -d /dev/sdf -o -|blkparse -i -
  8,80   1        1     0.000000000  4693  D   R 36 [sg_inq]
  8,80   1        2     0.000590071     0  C   R [0]
  8,80   1        3     0.000624346  4693  D   R 144 [sg_inq]
  8,80   1        4     0.001093812     0  C   R [0]
  8,80   1        5     0.001121290  4693  D   R 252 [sg_inq]
  8,80   1        6     0.001577685     0  C   R [0]
  8,80   1        7     0.001593793  4693  D   R 252 [sg_inq]
  8,80   1        8     0.002063534     0  C   R [0]
  8,80   0        1     2.004478167  4695  D   R 36 [sg_inq]
  8,80   0        2     2.005054640     0  C   R [0]
  8,80   0        3     2.005078936  4695  D   R 144 [sg_inq]
What will this look like when you send more I/O? You can use the dd utility to send 1MB of all-zero data to the drive:
$ sudo dd if=/dev/zero of=/dev/sdf1 bs=1M
The blktrace utility will dump the captured output (Listing 10); the seventh column is saying that a write (W) was sent, and the eighth column shows the size of the transfer (1342768 + 8). In one line, you see that a kernel worker thread is tasked with sending the write, and in the following line you see the logical block addressing (LBA) location relative to that drive or drive partition’s starting point (e.g., 1326392)
Listing 10: blktrace Output
  8,80   1     4398     0.027331017   218  M   W 1342768 + 8 [kworker/u16:3]
  8,80   1     4399     0.027332069   218  A   W 1342776 + 8 <- (8,81) 1326392
  8,80   1     4400     0.027332354   218  Q   W 1342776 + 8 [kworker/u16:3]
  8,80   1     4401     0.027332675   218  M   W 1342776 + 8 [kworker/u16:3]
  8,80   1     4402     0.027333775   218  A   W 1342784 + 8 <- (8,81) 1326400
  8,80   1     4403     0.027334066   218  Q   W 1342784 + 8 [kworker/u16:3]
  8,80   1     4404     0.027334387   218  M   W 1342784 + 8 [kworker/u16:3]
  8,80   1     4405     0.027335587   218  A   W 1342792 + 8 <- (8,81) 1326408
  8,80   1     4406     0.027335872   218  Q   W 1342792 + 8 [kworker/u16:3]
  8,80   1     4407     0.027336186   218  M   W 1342792 + 8 [kworker/u16:3]
  8,80   1     4408     0.027337256   218  A   W 1342800 + 8 <- (8,81) 1326416
  8,80   1     4409     0.027337542   218  Q   W 1342800 + 8 [kworker/u16:3]
  8,80   1     4410     0.027337900   218  M   W 1342800 + 8 [kworker/u16:3]
  8,80   1     4411     0.027339749   218  A   W 1342808 + 8 <- (8,81) 1326424
This output can and will get large and ugly, and it might take some time to parse through the content manually. Be sure not to let the utility capture for too long.
Similar to blktrace, you are able to view traffic hitting the SAS drives with the SCSI logging level function of the Linux kernel. The simplest way to observe and manage the kernel’s logging level settings is with the scsi_logging_level tool. For instance, to list the current logging level setting, invoke the command with the -g option:
$ sudo scsi_logging_level -g
Current scsi logging level:
/proc/sys/dev/scsi/logging_level = 0
SCSI_LOG_ERROR=0
SCSI_LOG_TIMEOUT=0
SCSI_LOG_SCAN=0
SCSI_LOG_MLQUEUE=0
SCSI_LOG_MLCOMPLETE=0
SCSI_LOG_LLQUEUE=0
SCSI_LOG_LLCOMPLETE=0
SCSI_LOG_HLQUEUE=0
SCSI_LOG_HLCOMPLETE=0
SCSI_LOG_IOCTL=0
The Linux SCSI subsystem is separated into three main levels: the upper layer comprises entry point drivers that allow you to connect with the underlying device (e.g., sd, sg, sr), and the mid layer connects the upper level to the interface driver of the lower level (i.e., Fibre Channel, SAS, iSCSI, etc.). Aside from connecting both upper and lower levels, the mid level is responsible for failure handling and error correction of failed requests propagated up from the underlying device or the host bus adaptor (HBA) in the low level connecting to that underlying device (Figure 1).
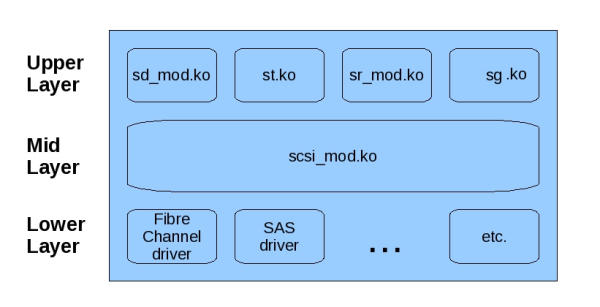 Figure 1: The general outline of the Linux SCSI subsystem.
To enable the highest level of logging for all SCSI errors and traffic in the low and mid layers, type:
$ sudo scsi_logging_level -s -E 7 -L 7 -M 7
New scsi logging level:
/proc/sys/dev/scsi/logging_level = 2096647
SCSI_LOG_ERROR=7
SCSI_LOG_TIMEOUT=0
SCSI_LOG_SCAN=0
SCSI_LOG_MLQUEUE=7
SCSI_LOG_MLCOMPLETE=7
SCSI_LOG_LLQUEUE=7
SCSI_LOG_LLCOMPLETE=7
SCSI_LOG_HLQUEUE=0
SCSI_LOG_HLCOMPLETE=0
SCSI_LOG_IOCTL=0
When logging is enabled, it will print SCSI level traces in both dmesg and syslog or the kernel log. For instance, in the example shown in Listing 11, you can the see SCSI Command Descriptor Blocks (CDBs) and traces printed for write, cache synchronization, and inquiry commands.
Listing 11: Kernel Log
Mar 27 15:21:24 dev-machine kernel: [  387.117129] sd 0:0:0:0: [sda] tag#3 Send: scmd 0x000000001842ae5b
Mar 27 15:21:24 dev-machine kernel: [  387.117134] sd 0:0:0:0: [sda] tag#3 CDB: Write(10) 2a 00 1d 04 5d 88 00 00 20 00
Mar 27 15:21:24 dev-machine kernel: [  387.117468] sd 0:0:0:0: [sda] tag#3 Done: SUCCESS Result: hostbyte=DID_OK driverbyte=DRIVER_OK
Mar 27 15:21:24 dev-machine kernel: [  387.117485] sd 0:0:0:0: [sda] tag#3 CDB: Write(10) 2a 00 1d 04 5d 88 00 00 20 00
Mar 27 15:21:24 dev-machine kernel: [  387.117491] sd 0:0:0:0: [sda] tag#3 scsi host busy 1 failed 0
Mar 27 15:21:24 dev-machine kernel: [  387.117495] sd 0:0:0:0: Notifying upper driver of completion (result 0)
Mar 27 15:21:24 dev-machine kernel: [  387.117585] sd 0:0:0:0: [sda] tag#24 Send: scmd 0x00000000fa2f2e1a
Mar 27 15:21:24 dev-machine kernel: [  387.117590] sd 0:0:0:0: [sda] tag#24 CDB: Synchronize Cache(10) 35 00 00 00 00 00 00 00 00 00
Mar 27 15:21:24 dev-machine kernel: [  387.130198] sd 0:0:0:0: [sda] tag#24 Done: SUCCESS Result: hostbyte=DID_OK driverbyte=DRIVER_OK
Mar 27 15:21:24 dev-machine kernel: [  387.130202] sd 0:0:0:0: [sda] tag#24 CDB: Synchronize Cache(10) 35 00 00 00 00 00 00 00 00 00
Mar 27 15:21:24 dev-machine kernel: [  387.130205] sd 0:0:0:0: [sda] tag#24 scsi host busy 1 failed 0
Mar 27 15:21:24 dev-machine kernel: [  387.130207] sd 0:0:0:0: Notifying upper driver of completion (result 0)

[ … ]

Mar 27 15:21:25 dev-machine kernel: [  387.655119] sd 2:0:1:1: [sdf] tag#3669 Send: scmd 0x00000000b06d61c4
Mar 27 15:21:25 dev-machine kernel: [  387.655122] sd 2:0:1:1: [sdf] tag#3669 CDB: Inquiry 12 00 00 00 90 00
Mar 27 15:21:25 dev-machine kernel: [  387.655587] sd 2:0:1:1: [sdf] tag#3669 Done: SUCCESS Result: hostbyte=DID_OK driverbyte=DRIVER_OK
Mar 27 15:21:25 dev-machine kernel: [  387.655589] sd 2:0:1:1: [sdf] tag#3669 CDB: Inquiry 12 00 00 00 90 00
Mar 27 15:21:25 dev-machine kernel: [  387.655591] sd 2:0:1:1: [sdf] tag#3669 scsi host busy 1 failed 0
Mar 27 15:21:25 dev-machine kernel: [  387.655593] sd 2:0:1:1: Notifying upper driver of completion (result 0)
Much like blktrace, this log can get pretty large and pretty ugly and should be enabled for brief periods at a time to avoid overwhelming the system. Another thing worth noting is that, with capture tools such as these, latencies are introduced and may alter the original I/O profile being chased, so proceed with caution.
To disable all logging, type:
$ sudo scsi_logging_level -s -E 0 -L 0 -M 0
New scsi logging level:
/proc/sys/dev/scsi/logging_level = 7
SCSI_LOG_ERROR=7
SCSI_LOG_TIMEOUT=0
SCSI_LOG_SCAN=0
SCSI_LOG_MLQUEUE=0
SCSI_LOG_MLCOMPLETE=0
SCSI_LOG_LLQUEUE=0
SCSI_LOG_LLCOMPLETE=0
SCSI_LOG_HLQUEUE=0
SCSI_LOG_HLCOMPLETE=0
SCSI_LOG_IOCTL=0
Perf Tracing
Another tool captures system traces, but at the Linux kernel level and in the context of CPU-executed operations. That tool is called perf and can be obtained from the Linux Kernel Archives. Some Linux distributions will offer it in their downloadable package repositories, but it might be best to download the latest and greatest from the website (Listing 12).
Listing 12: Get perf from kernel.org
$ wget https://mirrors.edge.kernel.org/pub/linux/kernel/tools/perf/v5.9.0/perf-5.9.0.tar.xz
--2021-03-21 15:40:30--  https://mirrors.edge.kernel.org/pub/linux/kernel/tools/perf/v5.9.0/perf-5.9.0.tar.xz
Resolving mirrors.edge.kernel.org (mirrors.edge.kernel.org)... 2604:1380:1:3600::1, 147.75.197.195
Connecting to mirrors.edge.kernel.org (mirrors.edge.kernel.org)|2604:1380:1:3600::1|:443... connected.
HTTP request sent, awaiting response... 200 OK
Length: 1857268 (1.8M) [application/x-xz]
Saving to: ‘perf-5.9.0.tar.xz’

perf-5.9.0.tar.xz                            100%[=============================================================================================>]   1.77M  8.85MB/s    in 0.2s

2021-03-21 15:40:30 (8.85 MB/s) - ‘perf-5.9.0.tar.xz’ saved [1857268/1857268]
Extract the file into a local working directory
$ tar xJf perf-5.9.0.tar.xz
and change into the perf source code subdirectory:
$ cd perf-5.9.0/tools/perf/
Resolve any and all dependencies and run make and make install utilities.
Now that perf is installed, you can generate I/O to a disk drive with fio,
$ sudo fio --bs=1K --ioengine=libaio --iodepth=32 --size=10g --direct=0 --runtime=60 --filename=/dev/sdf --rw=randread --numjobs=1 --name=test
and in another terminal window, invoke perf to record kernel operations executed at the CPU level for 30 seconds:
$ sudo ./perf record -a -g -- sleep 30
[ perf record: Woken up 8 times to write data ]
[ perf record: Captured and wrote 2.476 MB perf.data (12373 samples) ]
A perf.data file is generated in the local working directory. You can use tools to open this file directly for analysis or to generate other output from that file. For instance, to generate a report summarizing the 30 seconds, enter:
$ sudo ./perf script > out.script
$ sudo ./perf report > out.report
You will need both files just generated:
$ ls out.*
out.report  out.script
If you open the report file (i.e., out.report), you will see a summary of all the kernel operations and the amount of CPU it utilized during that 30-second snapshot, and you will see the subroutines tied to the top-level functions (Listing 13).
Listing 13: Summary of Kernel Operations
# To display the perf.data header info, please use --header/--header-only options.
#
#
# Total Lost Samples: 0
#
# Samples: 12K of event 'cycles'
# Event count (approx.): 1354753461
#
# Children      Self  Command          Shared Object             Symbol
# ........  ........  ...............  ........................  ................................................
#
    57.94%     0.00%  swapper          [kernel.kallsyms]         [k] secondary_startup_64
            |
            ---secondary_startup_64
               |
               |--48.28%--start_secondary
               |          |
               |           --48.25%--cpu_startup_entry
               |                     |
               |                      --47.68%--do_idle
               |                                |
               |                                |--36.89%--call_cpuidle
               |                                |          |
               |                                |           --36.81%--cpuidle_enter
               |                                |                     |
               |                                |                      --35.93%--cpuidle_enter_state
               |                                |                                |
               |                                |                                |--16.95%--intel_idle
               |                                |                                |
               |                                |                                |--10.25%--ret_from_intr
               |                                |                                |          |
               |                                |                                |           --10.21%--do_IRQ
               |                                |                                |                     |
               |                                |                                |                     |--7.62%--irq_exit
               |                                |                                |                     |          |
               |                                |                                |                     |           --7.47%--__softirqentry_text_start
               |                                |                                |                     |                     |
               |                                |                                |                     |                      --7.17%--blk_done_softirq
[ … ]

     0.51%     0.04%  fio              [kernel.kallsyms]         [k] mpage_alloc.isra.0
     0.50%     0.00%  fio              libc-2.31.so              [.] 0x00007f0576ab611a
            |
            ---0x7f0576ab611a

     0.50%     0.24%  swapper          [kernel.kallsyms]         [k] sched_clock_cpu
     0.49%     0.00%  perf             perf                      [.] 0x00005570000237de
     0.48%     0.18%  swapper          [kernel.kallsyms]         [k] ttwu_do_wakeup
     0.46%     0.19%  swapper          [kernel.kallsyms]         [k] set_next_entity
     0.46%     0.00%  rcu_sched        [kernel.kallsyms]         [k] ret_from_fork
     0.46%     0.00%  rcu_sched        [kernel.kallsyms]         [k] kthread
     0.46%     0.10%  swapper          [kernel.kallsyms]         [k] load_balance

[ … ]
The perf utility is useful when you might need to see where the CPU spends most of its time and provides insight into what could be holding up the completion of a function or shed light on poorly developed functions in the kernel space.
Sometimes it can be difficult to parse this data, which is why you can convert it into a visual chart called a flame graph. To do this, clone the git repo and convert the original output script file into an SVG (Listing 14).
Listing 14: Generating a Flame Graph
$ git clone https://github.com/brendangregg/FlameGraph.git
Cloning into 'FlameGraph'...
remote: Enumerating objects: 1067, done.
remote: Total 1067 (delta 0), reused 0 (delta 0), pack-reused 1067
Receiving objects: 100% (1067/1067), 1.87 MiB | 6.67 MiB/s, done.
Resolving deltas: 100% (612/612), done.

$ ./FlameGraph/stackcollapse-perf.pl out.script > out.folded
$ ./FlameGraph/flamegraph.pl out.folded > out.svg
When you open the file, you will see a visual representation of the 30-second capture (Figure 2). You can graphically navigate this graph with the click of your mouse. As you begin to click into the kernel functions, you will drill deeper and deeper into each function and the subfunctions it might be waiting on (Figures 3 and 4). You will also observe the total CPU time of the functions at the bottom of the SVG page.
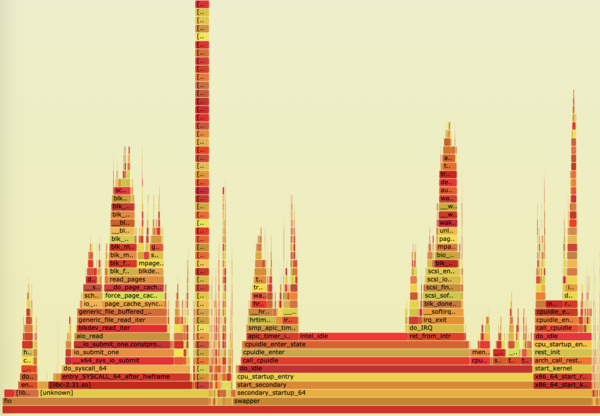 Figure 2: Flame graph: a visual representation of the perf data.
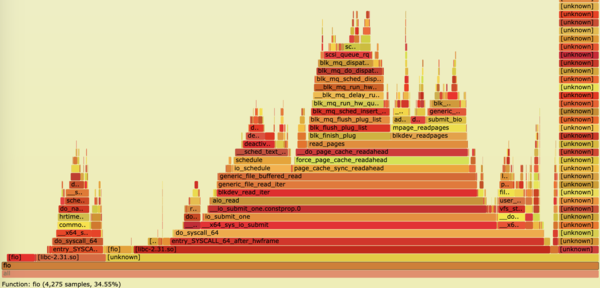 Figure 3: Clicking a kernel function in a flame graph focuses on the function and any linked subfunctions.
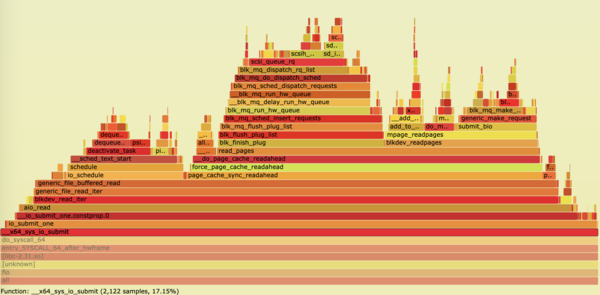 Figure 4: Drilling deeper into the flame graph and subfunctions.
« Previous 1 2 3 4 Next »