Appendix – MPI Application I/O Report from MPI Strace Analyzer
Strace Report
Introduction
This report summarizes the statistics in analyzing the strace results for a series of files that have been run through the strace_analyzer. This output allows you to compare multiple strace files such as those resulting from an MPI application. The number of files used in this analysis is 8. The files are:
file_18590.pickle
file_18591.pickle
file_18592.pickle
file_18593.pickle
file_18594.pickle
file_18595.pickle
file_18596.pickle
file_18597.pickle
This report is broken into several sections. In each section a summary of the results is presented and a statistical analysis of the files relative to each other is made. In addition, the statistics for each file are also presented.
1. Time Statistics
Table 1 below is a table of the total elapsed times and IO times in seconds for each of files.
Table 1 - Total time and IO Time (seconds)
| File | Total Time (secs) | IO Time (secs) |
|---|---|---|
| file_18590.pickle | 3376.81543207 |
7.677231 (0.23%) |
| file_18591.pickle | 3376.81946802 |
8.041807 (0.24%) |
| file_18592.pickle | 3376.81726694 |
11.776699 (0.35%) |
| file_18593.pickle | 3376.81776285 |
8.426562 (0.25%) |
| file_18594.pickle | 3376.81351113 |
9.711714 (0.29%) |
| file_18595.pickle | 3376.81144404 |
9.132170 (0.27%) |
| file_18596.pickle | 3376.80955601 |
8.558956 (0.25%) |
| file_18597.pickle | 3376.81430292 |
38.821670 (1.15%) |
Please note that the numbers in red are the maximum times (maximum total elapsed time and maximum IO time). The number below the IO time, in green, is the percentage of the total elapsed time used by IO.
The following results are the overall statistics for all of the files.
Maximum Elapsed Time: 3,376.819 seconds file: file_18591.pickle
Minimum Elapsed Time: 3,376.810 seconds file: file_18596.pickle
Average Total Elapsed Time = 3,376.815 seconds
Standard Deviation of Total Elapsed Time = 0.003117 seconds
Average IO Time = 12.768351 seconds (0.378% of Total Time)
Standard Deviation of IO Time = 9.919384 seconds
Figure 1 below plots the total elpased time (yellow) and the IO time (red) in seconds for all of the input files.
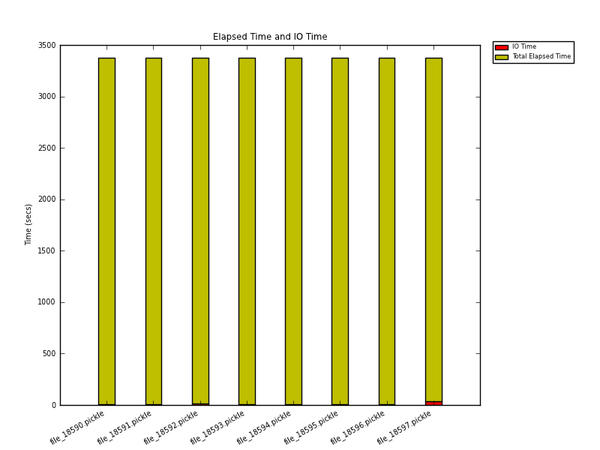 Figure 1 - Total time and IO Time (seconds)
Figure 1 - Total time and IO Time (seconds)
2. I/O Function Count
This section lists the I/O function command count (how many times a particular I/O command is called) for the various files. Table 2 below contains this information.
Table 2 - I/O Function Command Count
| Command | file_18590.pickle | file_18591.pickle | file_18592.pickle | file_18593.pickle | file_18594.pickle | file_18595.pickle | file_18596.pickle | file_18597.pickle |
|---|---|---|---|---|---|---|---|---|
| rename | 0 | 0 | 0 | 0 | 0 | 0 | 0 | 0 |
| lseek | 3,848 | 766 | 2,946 | 762 | 739 | 738 | 757 | 3,883 |
| fgetpos | 0 | 0 | 0 | 0 | 0 | 0 | 0 | 0 |
| lockf | 0 | 0 | 0 | 0 | 0 | 0 | 0 | 0 |
| creat | 0 | 0 | 0 | 0 | 0 | 0 | 0 | 0 |
| fclose | 0 | 0 | 0 | 0 | 0 | 0 | 0 | 0 |
| chmod | 0 | 0 | 0 | 0 | 0 | 0 | 0 | 1 |
| llseek | 0 | 0 | 0 | 0 | 0 | 0 | 0 | 0 |
| close | 72 | 70 | 73 | 70 | 70 | 72 | 69 | 121 |
| flock | 0 | 0 | 0 | 0 | 0 | 0 | 0 | 0 |
| open | 77 | 74 | 78 | 74 | 74 | 76 | 73 | 120 |
| lseek64 | 0 | 0 | 0 | 0 | 0 | 0 | 0 | 0 |
| stat64 | 0 | 0 | 0 | 0 | 0 | 0 | 0 | 0 |
| write | 35,369 | 28,438 | 42,656 | 36,786 | 46,779 | 26,834 | 26,883 | 47,224 |
| getdents | 8 | 6 | 8 | 6 | 6 | 6 | 6 | 10 |
| fseek | 0 | 0 | 0 | 0 | 0 | 0 | 0 | 0 |
| mkdir | 0 | 0 | 0 | 0 | 0 | 0 | 0 | 0 |
| opendir | 0 | 0 | 0 | 0 | 0 | 0 | 0 | 0 |
| fsetpos | 0 | 0 | 0 | 0 | 0 | 0 | 0 | 0 |
| access | 5 | 5 | 5 | 5 | 5 | 7 | 7 | 19 |
| ftell | 0 | 0 | 0 | 0 | 0 | 0 | 0 | 0 |
| fchmod | 0 | 0 | 0 | 0 | 0 | 0 | 0 | 0 |
| rewind | 0 | 0 | 0 | 0 | 0 | 0 | 0 | 0 |
| fstat | 1,384 | 143 | 1,084 | 143 | 143 | 144 | 144 | 1,058 |
| fcntl | 8 | 7 | 8 | 7 | 7 | 7 | 7 | 36 |
| stat | 36 | 36 | 36 | 36 | 36 | 36 | 36 | 643 |
| read | 2,798 | 350 | 1,896 | 347 | 334 | 330 | 325 | 2,728 |
| readdir | 0 | 0 | 0 | 0 | 0 | 0 | 0 | 0 |
| unlink | 5 | 4 | 5 | 4 | 4 | 5 | 4 | 10 |
| rewinddir | 0 | 0 | 0 | 0 | 0 | 0 | 0 | 0 |
| fsync | 21 | 21 | 21 | 21 | 21 | 22 | 26 | 31 |
| lseekm | 3,848 | 766 | 2,946 | 762 | 739 | 738 | 757 | 3,883 |
| seekdir | 0 | 0 | 0 | 0 | 0 | 0 | 0 | 0 |
| telldir | 0 | 0 | 0 | 0 | 0 | 0 | 0 | 0 |
| scandir | 0 | 0 | 0 | 0 | 0 | 0 | 0 | 0 |
The data listed in red are the maxium values. For example the data in the write row that is red is the file with the largest number of write function calls.
Figure 2 below plots the IO function count for all of the input files focusing on read(), write(), lseek() - all lseek functions, open(), and close() IO functions.
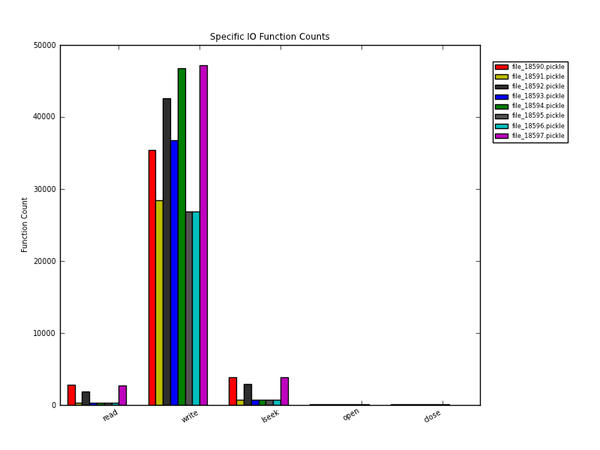 Figure 2 - IO function count for all input files for read, write, lseek, open, and close
Figure 2 - IO function count for all input files for read, write, lseek, open, and close
3. Write Statistics
This section presents statistical information about the write functions in the application. It focuses on use of the write(2) function in glibc. The pertinent details of the man pages are:
NAME
write - write to a file descriptor
SYNOPSIS
#include
ssize_t write(int fd, const void *buf, size_t count);
DESCRIPTION
write() writes up to count bytes from the buffer pointed buf to the file referred to by the file descriptor fd.
The number of bytes written may be less than count if, for example, there is insufficient space on the underlying physical medium, or the RLIMIT_FSIZE resource limit is encountered (see setrlimit(2)), or the call was interrupted by a signal handler after having written less than count bytes. (See also pipe(7).)
For a seekable file (i.e., one to which lseek(2) may be applied, for example, a regular file) writing takes place at the current file offset, and the file offset is incremented by the number of bytes actually written. If the file was open(2)ed with O_APPEND, the file offset is first set to the end of the file before writing. The adjustment of the file offset and the write operation are performed as an atomic step.
POSIX requires that a read(2) which can be proved to occur after a write() has returned returns the new data. Note that not all file systems are POSIX conforming.
The information and statistics in this section focus on the write() aspects of the application. Both tabular and graphical information is provided.
Table 3 below contains information on the total number of write function calls as a function of the data transfer size. The data is presented in
Table 3 - Total Write Function calls vs. data size
| IO Size Range |
Total Number of Syscalls | Per File Average |
Standard Deviation |
|---|---|---|---|
| 0KB < < 1KB | 248,982 | 31,122 | 7,565 |
| 1KB < < 8KB | 39,426 | 4,928 | 490 |
| 8KB < < 32KB | 148 | 18 | 12 |
| 32KB < < 128KB | 835 | 104 | 126 |
| 128KB < < 256KB | 4 | 0 | 1 |
| 256KB < < 512KB | 18 | 2 | 1 |
| 512KB < < 1MB | 23 | 2 | 2 |
| 1MB < < 10MB | 1,335 | 166 | 235 |
| 10MB < < 100MB | 2 | 0 | 0 |
| 100MB < < 1GB | 0 | 0 | 0 |
| 1GB < < 10GB | 0 | 0 | 0 |
| 10GB < < 100GB | 0 | 0 | 0 |
| 100GB < < 1TB | 0 | 0 | 0 |
| 1TB < < 10TB | 0 | 0 | 0 |
Table 4 below contains the number of write function calls for each file.
Table 4 - Write Function calls for each file as a function of size
| IO_Size_Range | file_18590.pickle | file_18591.pickle | file_18592.pickle | file_18593.pickle | file_18594.pickle | file_18595.pickle | file_18596.pickle | file_18597.pickle |
|---|---|---|---|---|---|---|---|---|
| 0KB < < 1KB | 30,070 | 23,099 | 37,496 | 31,502 | 42,044 | 22,318 | 22,440 | 40,013 |
| 1KB < < 8KB | 5,105 | 5,144 | 4,968 | 5,094 | 4,566 | 4,358 | 4,294 | 5,897 |
| 8KB < < 32KB | 14 | 14 | 14 | 15 | 14 | 14 | 14 | 49 |
| 32KB < < 128KB | 64 | 64 | 63 | 61 | 53 | 47 | 44 | 439 |
| 128KB < < 256KB | 0 | 2 | 0 | 0 | 0 | 0 | 0 | 2 |
| 256KB < < 512KB | 2 | 2 | 2 | 3 | 2 | 2 | 2 | 3 |
| 512KB < < 1MB | 3 | 2 | 2 | 3 | 2 | 4 | 3 | 4 |
| 1MB < < 10MB | 87 | 87 | 87 | 84 | 74 | 67 | 62 | 787 |
| 10MB < < 100MB | 0 | 0 | 0 | 0 | 0 | 0 | 0 | 2 |
| 100MB < < 1GB | 0 | 0 | 0 | 0 | 0 | 0 | 0 | 0 |
| 1GB < < 10GB | 0 | 0 | 0 | 0 | 0 | 0 | 0 | 0 |
| 10GB < < 100GB | 0 | 0 | 0 | 0 | 0 | 0 | 0 | 0 |
| 100GB < < 1TB | 0 | 0 | 0 | 0 | 0 | 0 | 0 | 0 |
| 1TB < < 10TB | 0 | 0 | 0 | 0 | 0 | 0 | 0 | 0 |
The next 5 figures plot the data contained in Table 4. The first figure, Figure 3, plots the write IO Function call Count for all of the intervals. The next 4 figures plot subsets of Figure 3. Figure 4 plots the write IO function call count for the KB range intervals. Figure 5 plots the write IO function call count for the MB range intervals. Figure 6 plots the write IO function call count for the GB range intervals. Figure 7 plots the write IO function call count for the TB range intervals.
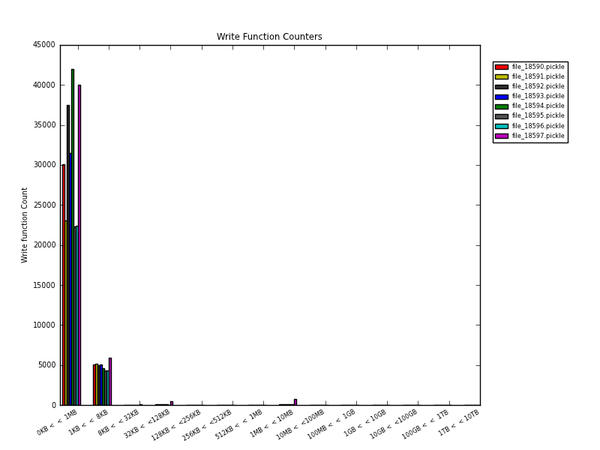 Figure 3 - Write IO function count for all input files for all intervals
Figure 3 - Write IO function count for all input files for all intervals
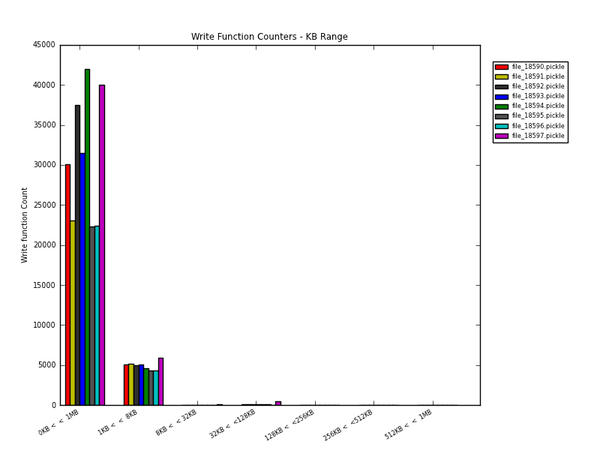 Figure 4 - Write IO function count for all input files for KB intervals
Figure 4 - Write IO function count for all input files for KB intervals
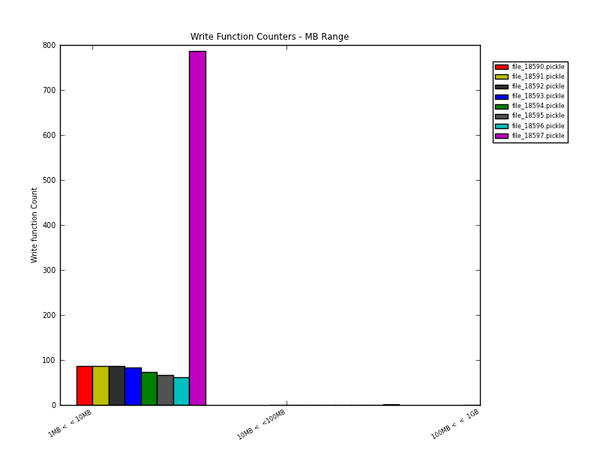 Figure 5 - Write IO function count for all input files for MB intervals
Figure 5 - Write IO function count for all input files for MB intervals
 Figure 6 - Write IO function count for all input files for GB intervals
Figure 6 - Write IO function count for all input files for GB intervals
 Figure 7 - Write IO function count for all input files for TB intervals
Figure 7 - Write IO function count for all input files for TB intervals
The following statistics are for the write() function for all of the files in the analysis.
Total number of Bytes written = 3,092,316,937 (3,092.317 MB)
Number of Write function calls = 290,969
Average (mean) bytes per call = 10,634.815 (bytes) (0.011 MB)
Standard Deviation bytes per call = 151,511.125208 (bytes) (0.151511 MB)
Mean Absolute Deviation = 159,176.444887 (bytes) (0.159176 MB)
Median Bytes per call = 58 (bytes) (0 MB)
Median Absolute Deviation = 10,601.735722 (bytes) (0.010602 MB)
Time for slowest write function (secs) = 0.255515 file: file_18597.pickle
Line location in file = 5,661
Table 5 below contains the write function statistics on a per file basis.
Table 5 - Write Function statistics for each file
| metric | file_18590.pickle | file_18591.pickle | file_18592.pickle | file_18593.pickle | file_18594.pickle | file_18595.pickle | file_18596.pickle | file_18597.pickle |
|---|---|---|---|---|---|---|---|---|
| Megabytes Written | 216.707618 | 215.797560 | 214.753958 | 210.183439 | 185.044082 | 171.302820 | 158.833557 | 1,719.693903 |
| Number write function calls | 35,369 | 28,438 | 42,656 | 36,786 | 46,779 | 26,834 | 26,883 | 47,224 |
| Average (mean) bytes per call | 6,131.210016 | 7,594.761737 | 5,037.388769 | 5,717.410342 | 3,957.738894 | 6,389.512122 | 5,913.606501 | 36,437.280765 |
| Standard Dev. bytes per call | 112,719.094422 | 125,983.644742 | 102,439.613282 | 109,218.001236 | 91,426.738466 | 116,868.815338 | 112,699.730421 | 281,991.450114 |
| Mean Abs Dev bytes per call | 116,747.324560 | 130,967.232975 | 105,827.358120 | 113,015.344928 | 94,075.741864 | 121,039.419341 | 116,504.573200 | 306,640.772077 |
| Median bytes per call | 109 | 58 | 55 | 58 | 58 | 58 | 58 | 54 |
| Median bytes per call | 6,083.299392 | 7,560.759414 | 5,007.137549 | 5,683.273407 | 3,921.769693 | 6,355.934204 | 5,879.403366 | 36,411.679994 |
| Slowest Time for write (secs) | 0.084869 | 0.148047 | 0.145167 | 0.138244 | 0.140369 | 0.135707 | 0.136007 | 0.255515 |
| Line for slowest for write | 1,485 | 1,484 | 1,484 | 1,484 | 1,477 | 1,480 | 1,475 | 5,661 |
Figure 8 plots the total megabytes written for each file.
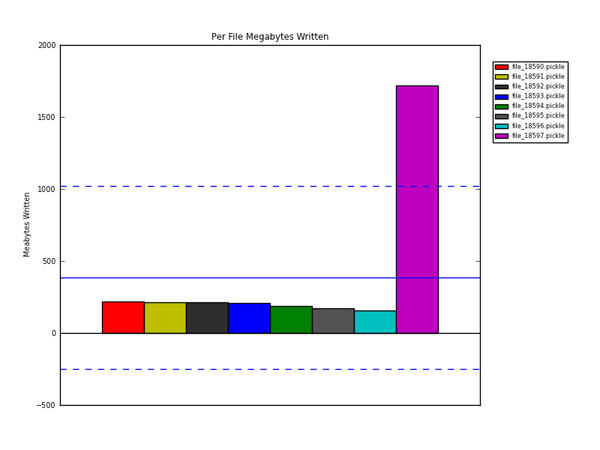 Figure 8 - Per File Write Amount for all input files
Figure 8 - Per File Write Amount for all input files
In Figure 8 the solid blue line is the average amount written in MB across all files. The two dashed blue lines show the +/- one standard deviation in the amount of data written in MB.
Figure 9 plots the number of write function calls for each file.
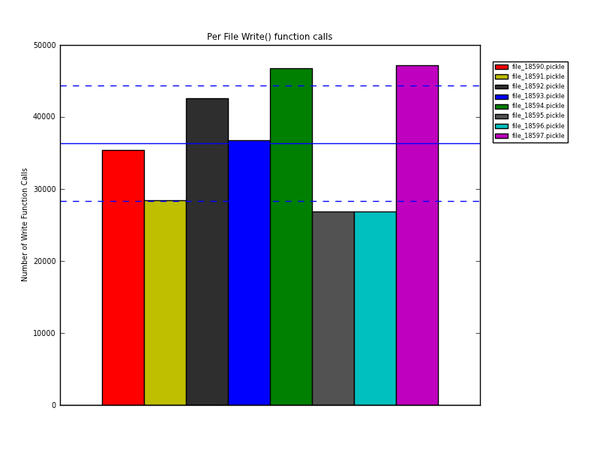 Figure 9 - Per File Write() function all input files
Figure 9 - Per File Write() function all input files
In Figure 9 the solid blue line is the average number of write() function calls across all files. The two dashed blue lines show the +/- one standard deviation in the number of write() functions called.
4. Read Statistics
This section presents statistical information about the read functions in the application. It focuses on use of the read(2) function in glibc. The pertinent details of the man pages are:
NAME
read - read from a file descriptor
SYNOPSIS
#include
ssize_t read(int fd, void *buf, size_t count);
DESCRIPTION
read() attempts to read up to count bytes from file descriptor fd into the buffer starting at buf.
If count is zero, read() returns zero and has no other results. If count is greater than SSIZE_MAX, the result is unspecified.
The information and statistics in this section focus on the read() aspects of the application. Both tabular and graphical information is provided.
Table 6 below contains information on the number of read function calls as a function of the data transfer size. The data is presented in
Table 6 - Read Function calls vs. data size
| IO Size Range |
Total Number of Read Syscalls | Per File Average |
Standard Deviation |
|---|---|---|---|
| 0KB < < 1KB | 442 | 55 | 8 |
| 1KB < < 8KB | 82 | 10 | 5 |
| 8KB < < 32KB | 96 | 12 | 16 |
| 32KB < < 128KB | 527 | 65 | 62 |
| 128KB < < 256KB | 754 | 94 | 83 |
| 256KB < < 512KB | 1,658 | 207 | 167 |
| 512KB < < 1MB | 2,022 | 252 | 275 |
| 1MB < < 10MB | 3,328 | 416 | 631 |
| 10MB < < 100MB | 3 | 0 | 0 |
| 100MB < < 1GB | 0 | 0 | 0 |
| 1GB < < 10GB | 0 | 0 | 0 |
| 10GB < < 100GB | 0 | 0 | 0 |
| 100GB < < 1TB | 0 | 0 | 0 |
| 1TB < < 10TB | 0 | 0 | 0 |
Table 7 below contains the number of read function calls for each file.
Table 7 - Read Function calls for each file
| IO_Size_Range | file_18590.pickle | file_18591.pickle | file_18592.pickle | file_18593.pickle | file_18594.pickle | file_18595.pickle | file_18596.pickle | file_18597.pickle |
|---|---|---|---|---|---|---|---|---|
| 0KB < < 1KB | 53 | 52 | 54 | 52 | 52 | 53 | 52 | 74 |
| 1KB < < 8KB | 16 | 7 | 9 | 7 | 7 | 7 | 7 | 22 |
| 8KB < < 32KB | 28 | 0 | 45 | 0 | 0 | 0 | 0 | 23 |
| 32KB < < 128KB | 145 | 29 | 195 | 29 | 30 | 28 | 29 | 42 |
| 128KB < < 256KB | 188 | 37 | 263 | 36 | 36 | 34 | 34 | 126 |
| 256KB < < 512KB | 404 | 94 | 550 | 94 | 90 | 90 | 90 | 246 |
| 512KB < < 1MB | 629 | 43 | 692 | 42 | 38 | 49 | 50 | 479 |
| 1MB < < 10MB | 1,310 | 64 | 64 | 63 | 57 | 45 | 39 | 1,686 |
| 10MB < < 100MB | 1 | 0 | 0 | 0 | 0 | 0 | 0 | 2 |
| 100MB < < 1GB | 0 | 0 | 0 | 0 | 0 | 0 | 0 | 0 |
| 1GB < < 10GB | 0 | 0 | 0 | 0 | 0 | 0 | 0 | 0 |
| 10GB < < 100GB | 0 | 0 | 0 | 0 | 0 | 0 | 0 | 0 |
| 100GB < < 1TB | 0 | 0 | 0 | 0 | 0 | 0 | 0 | 0 |
| 1TB < < 10TB | 0 | 0 | 0 | 0 | 0 | 0 | 0 | 0 |
The next 5 figures plot the data contained in Table 7. The first figure, Figure 10, plots the Read IO Function Count for all of the intervals. The next 4 figures plot subsets of Figure 10. Figure 11 plots the Write IO function count for the KB range intervals. Figure 12 plots the Write IO function count for the MB range intervals. Figure 13 plots the Write IO function count for the GB range intervals. Figure 14 plots the Write IO function count for the TB range intervals.
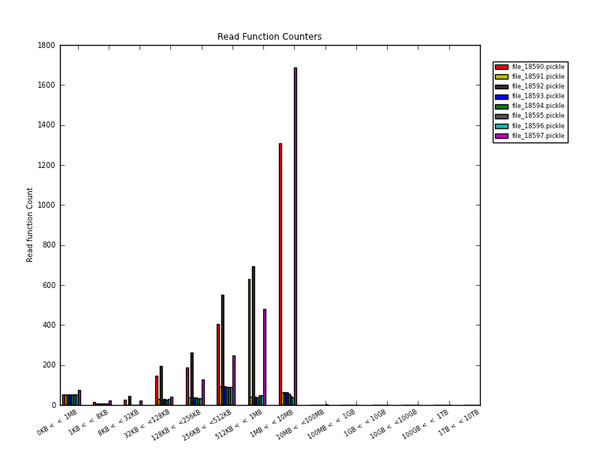 Figure 10 - Read IO function count for all input files for all intervals
Figure 10 - Read IO function count for all input files for all intervals
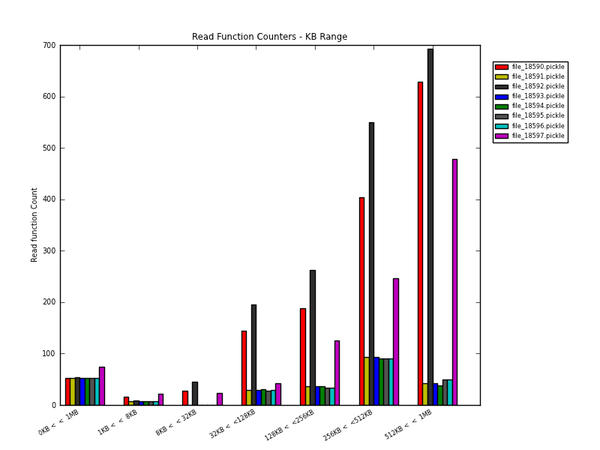 Figure 11 - Read IO function count for all input files for KB intervals
Figure 11 - Read IO function count for all input files for KB intervals
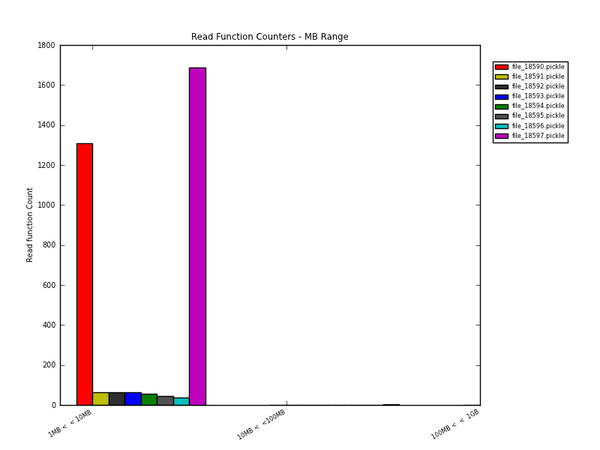 Figure 12 - Read IO function count for all input files for MB intervals
Figure 12 - Read IO function count for all input files for MB intervals
 Figure 13 - Read IO function count for all input files for GB intervals
Figure 13 - Read IO function count for all input files for GB intervals
 Figure 14 - Read IO function count for all input files for TB intervals
Figure 14 - Read IO function count for all input files for TB intervals
Overall summary of read functions. These statistics are for all of the files in in the analysis.
Total number of Bytes read = 7,850,388,044 (7,850.388044 MB)
Number of Read function calls = 9,108
Average (mean) bytes per call = 880,878.371185 (bytes) (0.880878 MB)
Standard Deviation bytes per call = 721,848.996629 (bytes) (0.721849 MB)
Mean Absolute Deviation = 573,996.685684 (bytes) (0.573997 MB)
Median Bytes per call = 672,127 (bytes) (1 MB)
Median Absolute Deviation = 573,051.721499 (bytes) (0.573052 MB)
Time for slowest read function (secs) = 0.063513 file: file_18595.pickle
Line location in file = 835
Table 8 below contains the read function statistics on a per file basis.
Table 8 - Read Function statistics for each file
| metric | file_18590.pickle | file_18591.pickle | file_18592.pickle | file_18593.pickle | file_18594.pickle | file_18595.pickle | file_18596.pickle | file_18597.pickle |
|---|---|---|---|---|---|---|---|---|
| Megabytes Read | 2,687.124647 | 198.635460 | 870.289438 | 186.226378 | 166.874496 | 163.854722 | 152.381284 | 3,425.001619 |
| Number read function calls | 2,798 | 350 | 1,896 | 347 | 334 | 330 | 325 | 2,728 |
| Average (mean) bytes per call | 968,682.280822 | 609,311.226994 | 464,898.204060 | 576,552.253870 | 538,304.825806 | 535,472.947712 | 506,250.112957 | 1,268,519.118148 |
| Standard Dev. bytes per call | 635,858.277337 | 793,159.580972 | 360,037.040958 | 655,924.995266 | 610,008.385354 | 606,946.126746 | 577,456.166857 | 790,424.632728 |
| Mean Abs Dev bytes per call | 573,916.058117 | 630,764.176524 | 261,314.399157 | 522,145.077784 | 476,906.209371 | 470,272.657084 | 432,054.474639 | 732,319.600868 |
| Median bytes per call | 938,594 | 430,311 | 438,525 | 430,299 | 420,694 | 425,487 | 393,216 | 1,379,816 |
| Median bytes per call | 533,627.598053 | 461,969.153374 | 254,478.884615 | 430,273.786378 | 404,422.677419 | 399,900.261438 | 375,047.667774 | 615,415.739630 |
| Slowest Time for read (secs) | 0.041213 | 0.041750 | 0.042122 | 0.041713 | 0.040967 | 0.063513 | 0.041730 | 0.041423 |
| Line for slowest for read | 845 | 845 | 845 | 845 | 845 | 835 | 845 | 846 |
Figure 15 plots the total megabytes read for each file.
 Figure 15 - Per File Read Amount for all input files
Figure 15 - Per File Read Amount for all input files
In Figure 15 the solid blue line is the average amount read in MB across all files. The two dashed blue lines show the +/- one standard deviation in the amount of data read in MB.
Figure 16 plots the number of read function calls for each file.
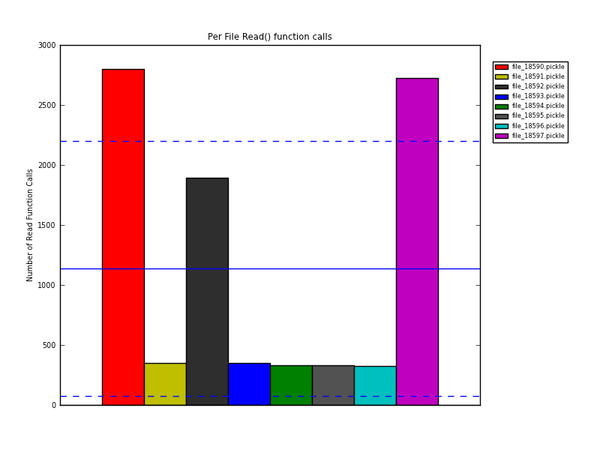 Figure 16 - Per File read() function all input files
Figure 16 - Per File read() function all input files
In Figure 16 the solid blue line is the average number of read() function calls across all files. The two dashed blue lines show the +/- one standard deviation in the number of read() functions called.
5. Close Statistics
This section presents statistical information about the close() functions in the application. Below are the statistics across all files in the analysis.
Total number of close function calls for all files = 617
Average time for close function calls (secs) = 3.32437395659e-05
Standard Deviation for close function calls (secs) = 0.000109286534399
Median close function time (secs) = 5e-06
Time for fastest close() across all files (secs): 3e-06
file: file_18592.pickle line number: 28
Time for slowest close() across all files (secs): 0.001728
file: file_18592.pickle line number: 12308
This section lists the close() function statistics for the input files. It also lists the fastest and slowest close() function for each file. Table 9 below contains this information
Table 9 - Close Function details - per file basis
| Metric | file_18590.pickle | file_18591.pickle | file_18592.pickle | file_18593.pickle | file_18594.pickle | file_18595.pickle | file_18596.pickle | file_18597.pickle |
|---|---|---|---|---|---|---|---|---|
| Number of close() calls | 72 | 70 | 73 | 70 | 70 | 72 | 69 | 121 |
| Fastest close() call (secs) | 0.00000400 | 0.00000400 | 0.00000300 | 0.00000300 | 0.00000400 | 0.00000400 | 0.00000400 | 0.00000400 |
| Line number of file | 28 | 80 | 733 | 924 | 80 | 28 | 28 | 28 |
| Slowest close() call (secs) | 0.00079300 | 0.00035200 | 0.00172800 | 0.00088700 | 0.00025400 | 0.00034400 | 0.00037100 | 0.00080600 |
| Line number of file | 6,856 | 29,983 | 6,633 | 1,710 | 1,685 | 6,102 | 6,046 | 12,308 |
6. Open Statistics
This section presents statistical information about the open() functions in the application. Below are the statistics across all files in the analysis.
Total number of open function calls for all files = 646
Average time for open function calls (secs) = 0.000136857585139
Standard Deviation for open function calls (secs) = 0.000511730042175
Median open function time (secs) = 8e-06
Time for fastest open() across all files (secs): 5e-06
file: file_18593.pickle line number: 182
Time for slowest open() across all files (secs): 0.008109
file: file_18596.pickle line number: 48265
This section lists the open() function statistics for the input files. It also lists the fastest and slowest open() function for each file. Table 10 below contains this information
Table 10 - Open Function details - per file basis
| Metric | file_18590.pickle | file_18591.pickle | file_18592.pickle | file_18593.pickle | file_18594.pickle | file_18595.pickle | file_18596.pickle | file_18597.pickle |
|---|---|---|---|---|---|---|---|---|
| Number of open() calls | 77 | 74 | 78 | 74 | 74 | 76 | 73 | 120 |
| Fastest open() call (secs) | 0.00000600 | 0.00000600 | 0.00000600 | 0.00000500 | 0.00000500 | 0.00000600 | 0.00000600 | 0.00000600 |
| Line number of file | 62 | 181 | 181 | 776 | 406 | 62 | 62 | 182 |
| Slowest open() call (secs) | 0.00392700 | 0.00226900 | 0.00195700 | 0.00417900 | 0.00418400 | 0.00132800 | 0.00810900 | 0.00383800 |
| Line number of file | 35,666 | 29,805 | 45,213 | 38,330 | 48,296 | 28,229 | 28,424 | 48,265 |
7. Lseek Statistics
This section presents statistical information about the lseek() functions in the Table 11 below contains information about which files experienced a lseek() operation while performing I/O. This is done for each input file.
Table 11 - Lseek Function details - per file basis
| Analysis File | File |
Number of lseek() operations |
|---|---|---|
| file_18590.pickle | /dev/shm/Intel_MPI_zomd8c | 387 |
| /dev/shm/Intel_MPI_zomd8c | 387 | |
| /etc/ld.so.cache | 387 | |
| /usr/lib64/libdat.so | 387 | |
| /usr/lib64/libibverbs.so.1 | 387 | |
| /etc/dat.conf | 387 | |
| /etc/ld.so.cache | 387 | |
| /usr/lib64/libdat.so | 387 | |
| /usr/lib64/libibverbs.so.1 | 387 | |
| /etc/dat.conf | 387 | |
| /etc/ld.so.cache | 387 | |
| /usr/lib64/libdaplcma.so.1 | 387 | |
| /usr/lib64/librdmacm.so.1 | 387 | |
| /lustre/icbci001/apps/lsdyna/benchmark-file/tmp/./mes0001 | 1 | |
| /etc/localtime | 209 | |
| /dev/shm/Intel_MPI_FlKyRG | 209 | |
| /dev/shm/Intel_MPI_Nwgmhn | 209 | |
| /dev/shm/Intel_MPI_Nwgmhn | 209 | |
| /lustre/icbci001/apps/lsdyna/benchmark-file/tmp/./scr0001 | 209 | |
| /lustre/icbci001/apps/lsdyna/benchmark-file/tmp/./scr0001h | 209 | |
| /lustre/icbci001/apps/lsdyna/benchmark-file/tmp/./scr0001 | 209 | |
| /lustre/icbci001/apps/lsdyna/benchmark-file/tmp/./scr0001h | 1 | |
| ./disk8.0001 | 1 | |
| ./d3full.scr.0001 | 209 | |
| ./runrsf.0001 | 209 | |
| file_18591.pickle | /dev/shm/Intel_MPI_zomd8c | 387 |
| /dev/shm/Intel_MPI_zomd8c | 387 | |
| /etc/ld.so.cache | 387 | |
| /usr/lib64/libdat.so | 387 | |
| /usr/lib64/libibverbs.so.1 | 387 | |
| /etc/dat.conf | 387 | |
| /etc/ld.so.cache | 387 | |
| /usr/lib64/libdat.so | 387 | |
| /usr/lib64/libibverbs.so.1 | 387 | |
| /etc/dat.conf | 387 | |
| /etc/ld.so.cache | 387 | |
| /usr/lib64/libdaplcma.so.1 | 387 | |
| /usr/lib64/librdmacm.so.1 | 387 | |
| /lustre/icbci001/apps/lsdyna/benchmark-file/tmp/./mes0002 | 1 | |
| /etc/localtime | 209 | |
| /dev/shm/Intel_MPI_ft2sMG | 209 | |
| /dev/shm/Intel_MPI_ncyzQG | 209 | |
| /dev/shm/Intel_MPI_ncyzQG | 209 | |
| /dev/shm/Intel_MPI_Nwgmhn | 209 | |
| /lustre/icbci001/apps/lsdyna/benchmark-file/tmp/./scr0002 | 209 | |
| /lustre/icbci001/apps/lsdyna/benchmark-file/tmp/./scr0002h | 209 | |
| /lustre/icbci001/apps/lsdyna/benchmark-file/tmp/./scr0002 | 209 | |
| /lustre/icbci001/apps/lsdyna/benchmark-file/tmp/./scr0002h | 1 | |
| ./disk8.0002 | 1 | |
| ./d3full.scr.0002 | 209 | |
| ./runrsf.0002 | 209 | |
| file_18592.pickle | /dev/shm/Intel_MPI_zomd8c | 387 |
| /dev/shm/Intel_MPI_zomd8c | 387 | |
| /etc/ld.so.cache | 387 | |
| /usr/lib64/libdat.so | 387 | |
| /usr/lib64/libibverbs.so.1 | 387 | |
| /etc/dat.conf | 387 | |
| /etc/ld.so.cache | 387 | |
| /usr/lib64/libdat.so | 387 | |
| /usr/lib64/libibverbs.so.1 | 387 | |
| /etc/dat.conf | 387 | |
| /etc/ld.so.cache | 387 | |
| /usr/lib64/libdaplcma.so.1 | 387 | |
| /usr/lib64/librdmacm.so.1 | 387 | |
| /lustre/icbci001/apps/lsdyna/benchmark-file/tmp/./mes0003 | 1 | |
| /etc/localtime | 209 | |
| /dev/shm/Intel_MPI_ncyzQG | 209 | |
| /dev/shm/Intel_MPI_xgidSo | 209 | |
| /dev/shm/Intel_MPI_xgidSo | 209 | |
| /lustre/icbci001/apps/lsdyna/benchmark-file/tmp/./scr0003 | 209 | |
| /lustre/icbci001/apps/lsdyna/benchmark-file/tmp/./scr0003h | 209 | |
| /lustre/icbci001/apps/lsdyna/benchmark-file/tmp/./scr0003 | 209 | |
| /lustre/icbci001/apps/lsdyna/benchmark-file/tmp/./scr0003h | 1 | |
| ./disk8.0003 | 1 | |
| /dev/shm/Intel_MPI_DZPdOX | 209 | |
| /dev/shm/Intel_MPI_DZPdOX | 209 | |
| ./d3full.scr.0003 | 209 | |
| ./runrsf.0003 | 209 | |
| file_18593.pickle | /dev/shm/Intel_MPI_zomd8c | 387 |
| /dev/shm/Intel_MPI_zomd8c | 387 | |
| /etc/ld.so.cache | 387 | |
| /usr/lib64/libdat.so | 387 | |
| /usr/lib64/libibverbs.so.1 | 387 | |
| /etc/dat.conf | 387 | |
| /etc/ld.so.cache | 387 | |
| /usr/lib64/libdat.so | 387 | |
| /usr/lib64/libibverbs.so.1 | 387 | |
| /etc/dat.conf | 387 | |
| /etc/ld.so.cache | 387 | |
| /usr/lib64/libdaplcma.so.1 | 387 | |
| /usr/lib64/librdmacm.so.1 | 387 | |
| /lustre/icbci001/apps/lsdyna/benchmark-file/tmp/./mes0004 | 1 | |
| /etc/localtime | 209 | |
| /dev/shm/Intel_MPI_BYKhnI | 209 | |
| /dev/shm/Intel_MPI_vQZsKG | 209 | |
| /dev/shm/Intel_MPI_vQZsKG | 209 | |
| /dev/shm/Intel_MPI_IKgyPG | 209 | |
| /dev/shm/Intel_MPI_IKgyPG | 209 | |
| /dev/shm/Intel_MPI_xgidSo | 209 | |
| /lustre/icbci001/apps/lsdyna/benchmark-file/tmp/./scr0004 | 209 | |
| /lustre/icbci001/apps/lsdyna/benchmark-file/tmp/./scr0004h | 209 | |
| /lustre/icbci001/apps/lsdyna/benchmark-file/tmp/./scr0004 | 209 | |
| /lustre/icbci001/apps/lsdyna/benchmark-file/tmp/./scr0004h | 1 | |
| ./disk8.0004 | 1 | |
| ./d3full.scr.0004 | 209 | |
| ./runrsf.0004 | 209 | |
| file_18594.pickle | /dev/shm/Intel_MPI_zomd8c | 387 |
| /dev/shm/Intel_MPI_zomd8c | 387 | |
| /etc/ld.so.cache | 387 | |
| /usr/lib64/libdat.so | 387 | |
| /usr/lib64/libibverbs.so.1 | 387 | |
| /etc/dat.conf | 387 | |
| /etc/ld.so.cache | 387 | |
| /usr/lib64/libdat.so | 387 | |
| /usr/lib64/libibverbs.so.1 | 387 | |
| /etc/dat.conf | 387 | |
| /etc/ld.so.cache | 387 | |
| /usr/lib64/libdaplcma.so.1 | 387 | |
| /usr/lib64/librdmacm.so.1 | 387 | |
| /lustre/icbci001/apps/lsdyna/benchmark-file/tmp/./mes0005 | 1 | |
| /etc/localtime | 209 | |
| /dev/shm/Intel_MPI_IKgyPG | 209 | |
| /dev/shm/Intel_MPI_NG3cfn | 209 | |
| /dev/shm/Intel_MPI_NG3cfn | 209 | |
| /lustre/icbci001/apps/lsdyna/benchmark-file/tmp/./scr0005 | 209 | |
| /lustre/icbci001/apps/lsdyna/benchmark-file/tmp/./scr0005h | 209 | |
| /lustre/icbci001/apps/lsdyna/benchmark-file/tmp/./scr0005 | 209 | |
| /lustre/icbci001/apps/lsdyna/benchmark-file/tmp/./scr0005h | 1 | |
| ./disk8.0005 | 1 | |
| /dev/shm/Intel_MPI_H8Srd6 | 209 | |
| /dev/shm/Intel_MPI_H8Srd6 | 209 | |
| ./d3full.scr.0005 | 209 | |
| ./runrsf.0005 | 209 | |
| file_18595.pickle | /dev/shm/Intel_MPI_zomd8c | 387 |
| /dev/shm/Intel_MPI_zomd8c | 387 | |
| /etc/ld.so.cache | 387 | |
| /usr/lib64/libdat.so | 387 | |
| /usr/lib64/libibverbs.so.1 | 387 | |
| /etc/dat.conf | 387 | |
| /etc/ld.so.cache | 387 | |
| /usr/lib64/libdat.so | 387 | |
| /usr/lib64/libibverbs.so.1 | 387 | |
| /etc/dat.conf | 387 | |
| /etc/ld.so.cache | 387 | |
| /usr/lib64/libdaplcma.so.1 | 387 | |
| /usr/lib64/librdmacm.so.1 | 387 | |
| /lustre/icbci001/apps/lsdyna/benchmark-file/tmp/./mes0006 | 1 | |
| /etc/localtime | 209 | |
| /dev/shm/Intel_MPI_vQZsKG | 209 | |
| /dev/shm/Intel_MPI_4m1pPG | 209 | |
| /dev/shm/Intel_MPI_4m1pPG | 209 | |
| /dev/shm/Intel_MPI_NG3cfn | 209 | |
| /lustre/icbci001/apps/lsdyna/benchmark-file/tmp/./scr0006 | 209 | |
| /lustre/icbci001/apps/lsdyna/benchmark-file/tmp/./scr0006h | 209 | |
| /lustre/icbci001/apps/lsdyna/benchmark-file/tmp/./scr0006 | 209 | |
| /lustre/icbci001/apps/lsdyna/benchmark-file/tmp/./scr0006h | 1 | |
| ./disk8.0006 | 1 | |
| ./disk8a.0006 | 2 | |
| /dev/shm/Intel_MPI_4pgr01 | 209 | |
| /dev/shm/Intel_MPI_4pgr01 | 209 | |
| ./d3full.scr.0006 | 209 | |
| ./runrsf.0006 | 209 | |
| file_18596.pickle | /dev/shm/Intel_MPI_zomd8c | 387 |
| /dev/shm/Intel_MPI_zomd8c | 387 | |
| /etc/ld.so.cache | 387 | |
| /usr/lib64/libdat.so | 387 | |
| /usr/lib64/libibverbs.so.1 | 387 | |
| /etc/dat.conf | 387 | |
| /etc/ld.so.cache | 387 | |
| /usr/lib64/libdat.so | 387 | |
| /usr/lib64/libibverbs.so.1 | 387 | |
| /etc/dat.conf | 387 | |
| /etc/ld.so.cache | 387 | |
| /usr/lib64/libdaplcma.so.1 | 387 | |
| /usr/lib64/librdmacm.so.1 | 387 | |
| /lustre/icbci001/apps/lsdyna/benchmark-file/tmp/./mes0007 | 1 | |
| /etc/localtime | 209 | |
| /dev/shm/Intel_MPI_4m1pPG | 209 | |
| /dev/shm/Intel_MPI_QV00CT | 209 | |
| /dev/shm/Intel_MPI_QV00CT | 209 | |
| /lustre/icbci001/apps/lsdyna/benchmark-file/tmp/./scr0007 | 209 | |
| /lustre/icbci001/apps/lsdyna/benchmark-file/tmp/./scr0007h | 209 | |
| /lustre/icbci001/apps/lsdyna/benchmark-file/tmp/./scr0007 | 209 | |
| /lustre/icbci001/apps/lsdyna/benchmark-file/tmp/./scr0007h | 1 | |
| ./disk8.0007 | 1 | |
| ./disk8a.0007 | 2 | |
| ./d3full.scr.0007 | 209 | |
| ./runrsf.0007 | 209 | |
| file_18597.pickle | /dev/shm/Intel_MPI_zomd8c | 387 |
| /etc/ld.so.cache | 387 | |
| /usr/lib64/libdat.so | 387 | |
| /usr/lib64/libibverbs.so.1 | 387 | |
| /etc/dat.conf | 387 | |
| /etc/ld.so.cache | 387 | |
| /usr/lib64/libdat.so | 387 | |
| /usr/lib64/libibverbs.so.1 | 387 | |
| /etc/dat.conf | 387 | |
| /etc/ld.so.cache | 387 | |
| /usr/lib64/libdaplcma.so.1 | 387 | |
| /usr/lib64/librdmacm.so.1 | 387 | |
| /proc/stat | 1 | |
| /proc/stat | 1 | |
| /etc/localtime | 1 | |
| /etc/nsswitch.conf | 209 | |
| /etc/ld.so.cache | 209 | |
| /lib64/libnss_files.so.2 | 209 | |
| /etc/passwd | 209 | |
| /etc/host.conf | 209 | |
| /etc/hosts | 209 | |
| /proc/net/dev | 209 | |
| /etc/hosts | 1 | |
| /etc/ld.so.cache | 1 | |
| /lib64/libnss_nis.so.2 | 1 | |
| /lib64/libnsl.so.1 | 1 | |
| /var/yp/binding/ibc.mti.com.2 | 1 | |
| /etc/hosts | 1 | |
| /var/yp/binding/ibc.mti.com.2 | 1 | |
| /etc/hosts | 209 | |
| /var/yp/binding/ibc.mti.com.2 | 209 | |
| /lustre/icbci001/apps/lsdyna/benchmark-file/3cars/3cars_shell2_150ms.k | 209 | |
| /dev/null | 1 | |
| /lustre/icbci001/apps/lsdyna/benchmark-file/tmp/d3hsp | 2 | |
| /lustre/icbci001/apps/lsdyna/benchmark-file/tmp/./mes0000 | 1 | |
| bg_switch | 2,493 | |
| /lustre/icbci001/apps/lsdyna/benchmark-file/tmp/./adptmp | 2,493 | |
| /lustre/icbci001/apps/lsdyna/benchmark-file/tmp/./adptmp | 209 | |
| . | 2,493 | |
| mpptbin.lsda | 2,493 | |
| /lustre/icbci001/apps/lsdyna/benchmark-file/tmp/ldcrvv | 23 | |
| ./d3plot | 103 | |
| ./d3thdt | 10 | |
| ./disk8.0000 | 269 | |
| ./mppscr | 384 | |
| . | 2,493 | |
| ./mpptbin.lsda | 23 | |
| ./mpptbin.lsda | 2,493 | |
| ./mppscr | 23 | |
| /proc/meminfo | 384 | |
| /dev/shm/Intel_MPI_BYKhnI | 23 | |
| /dev/shm/Intel_MPI_BYKhnI | 23 | |
| /dev/shm/Intel_MPI_ft2sMG | 23 | |
| /dev/shm/Intel_MPI_ft2sMG | 23 | |
| /dev/shm/Intel_MPI_FlKyRG | 23 | |
| /dev/shm/Intel_MPI_FlKyRG | 23 | |
| /dev/shm/Intel_MPI_QV00CT | 23 | |
| /lustre/icbci001/apps/lsdyna/benchmark-file/tmp/./scr0000 | 23 | |
| ./switch.rd | 384 | |
| /lustre/icbci001/apps/lsdyna/benchmark-file/tmp/./scr0000h | 23 | |
| /lustre/icbci001/apps/lsdyna/benchmark-file/tmp/./scr0000 | 209 | |
| /lustre/icbci001/apps/lsdyna/benchmark-file/tmp/./scr0000h | 23 | |
| /lustre/icbci001/apps/lsdyna/benchmark-file/tmp/./glstat | 23 | |
| /lustre/icbci001/apps/lsdyna/benchmark-file/tmp/part_des | 384 | |
| ./switch.rd | 2,493 | |
| . | 2,493 | |
| ./binout0000 | 2,493 | |
| /lustre/icbci001/apps/lsdyna/benchmark-file/tmp/part_des | 384 | |
| /lustre/icbci001/apps/lsdyna/benchmark-file/tmp/status.out | 209 | |
| /dev/shm/Intel_MPI_DZPdOX | 209 | |
| /dev/shm/Intel_MPI_4pgr01 | 209 | |
| /dev/shm/Intel_MPI_H8Srd6 | 209 | |
| ./d3plot01 | 209 | |
| ./d3plot02 | 209 | |
| ./d3full.scr.0000 | 103 | |
| ./runfull | 384 | |
| ./runfull | 384 | |
| ./runrsf.0000 | 103 | |
| ./d3plot03 | 209 |
8. IOPS Statistics
This section presents statistical information about the IOPS performance while the application was running. The following statistical data is for the peak IOPS across all files.
Maximum Peak Write IOPS = 2444 file: file_18595.pickle
Maximum Peak Read IOPS = 153 file: file_18591.pickle
Maximum Peak Total IOPS = 2444 file: file_18595.pickle
Average Peak Write IOPS = 2056.75
Standard Deviation Peak Write IOPS = 247.330623862
Average Peak Read IOPS = 139.75
Standard Deviation Peak Read IOPS = 12.8038080273
Average Peak Total IOPS = 2058.75
Standard Deviation Peak Total IOPS = 245.587942497
The following statistical data is for the Overall IOPS across all files. Remember that the Overall IOPS are computed as the total IOPS divided by the total application time.
Average Overall Write IOPS = 10.763581995
Standard Deviation Overall Write IOPS = 2.36588573648
Average Overall Read IOPS = 0.329896633154
Standard Deviation Overall Read IOPS = 0.315014380446
Average Overall Total IOPS = 11.8788340116
Standard Deviation Overall Total IOPS = 2.9381477474
Table 12 below contains this information.
Table 12 - IOPS Summary for all files
| Command | file_18590.pickle | file_18591.pickle | file_18592.pickle | file_18593.pickle | file_18594.pickle | file_18595.pickle | file_18596.pickle | file_18597.pickle |
|---|---|---|---|---|---|---|---|---|
| Max Write IOPS | 2,099 | 1,647 | 1,903 | 2,322 | 2,444 | 1,835 | 1,996 | 2,208 |
| time (secs) | 66 | 58 | 75 | 61 | 70 | 44 | 57 | 10 |
| Max Read IOPS | 153 | 143 | 143 | 143 | 143 | 143 | 143 | 107 |
| time (secs) | 41 | 41 | 41 | 41 | 41 | 41 | 41 | 2,260 |
| Max Total IOPS | 2,099 | 1,647 | 1,903 | 2,322 | 2,444 | 1,851 | 1,996 | 2,208 |
| time (secs) | 66 | 58 | 75 | 61 | 70 | 44 | 57 | 10 |
| Overall Write IOPS | 10 | 8 | 12 | 10 | 13 | 7 | 7 | 13 |
| Overall Read IOPS | 0 | 0 | 0 | 0 | 0 | 0 | 0 | 0 |
| Overall Total IOPS | 12 | 8 | 14 | 11 | 14 | 8 | 8 | 16 |
Figure 17 plots the peak write IOPS for each file.
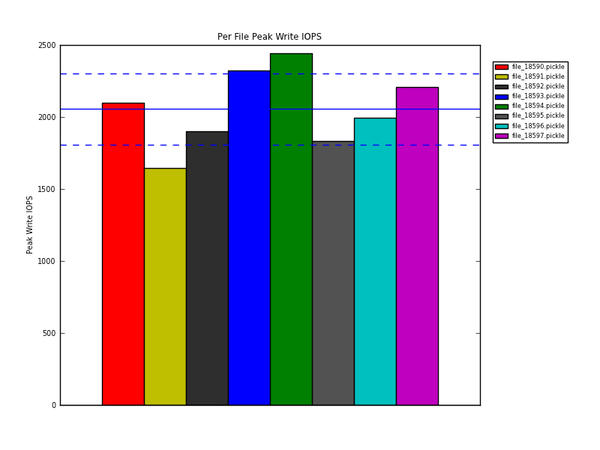 Figure 17 - Per File Peak Write IOPS for all input files
Figure 17 - Per File Peak Write IOPS for all input files
In Figure 17 the solid blue line is the average Peak Write IOPS across all files. The two dashed blue lines show the +/- one standard deviation in the Peak Write IOPS.
Figure 18 plots the peak read IOPS for each file.
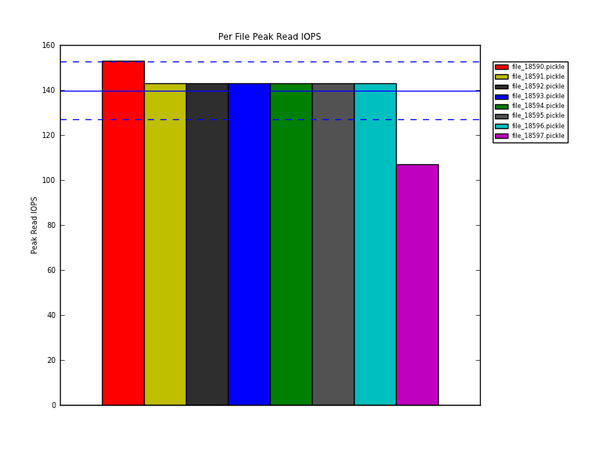 Figure 18 - Per File Peak Read IOPS for all input files
Figure 18 - Per File Peak Read IOPS for all input files
In Figure 18 the solid blue line is the average Peak Read IOPS across all files. The two dashed blue lines show the +/- one standard deviation in the Peak Read IOPS.
Figure 19 plots the peak total IOPS for each file.
 Figure 19 - Per File Peak Total IOPS for all input files
Figure 19 - Per File Peak Total IOPS for all input files
In Figure 19 the solid blue line is the average Peak Total IOPS across all files. The two dashed blue lines show the +/- one standard deviation in the Peak Total IOPS.
Figure 20 plots the average write IOPS for each file.
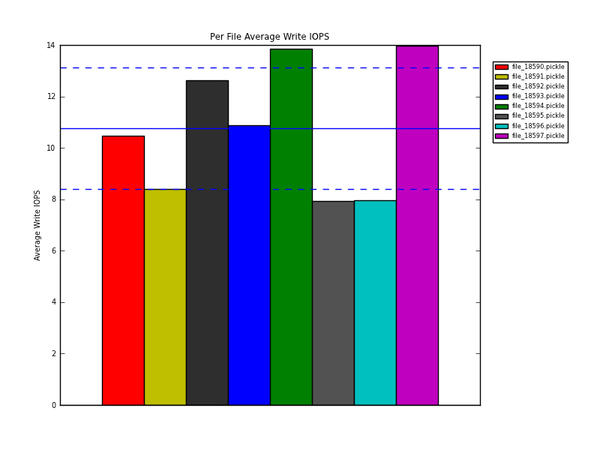 Figure 20 - Per File Average Write IOPS for all input files
Figure 20 - Per File Average Write IOPS for all input files
In Figure 20 the solid blue line is the average write IOPS across all files. The two dashed blue lines show the +/- one standard deviation in the Average Write IOPS.