Resource Monitoring For Remote Applications

Remora combines profiling and system monitoring to help you get to the root of application problems by revealing its use of resources.
Monitoring systems and profiling applications have long been a passion of mine.In the case of monitoring, I've taken the point of view that the system administrator should focuson monitoring the system as a whole andon keeping track of system behavior over time byasking questions such as, “Is it performing as it should?” and “Are the resources being utilized as much as possible?”
In the case of profiling, I have focused on individual applications, either serial or parallel. Profiling usually means trying to understand application resource usage patterns by answering questions such as, “How does the application use the CPU?” and “How does the application perform I/O?” Answering these questions are some of the goals of application profiling.
Remora
A very useful HPC tool named REMORA (REsource MOnitoring for Remote Applications; hereafter referred to as Remora) from the University of Texas Advanced Computing Center (TACC), combines monitoring and profiling to provide information about an application. Unlike pure system monitoring or general profiling, it is focused on the user and the user’s application, and the results are intended to help the user understand the resources that were used to run an application.
Remora is not strictly a profiler, and it's not strictly a monitoring tool in the traditional sense of monitoring the entire cluster. Rather, it provides per-node and per-job resource utilization data. This data can be used to understand how the application performs on the system. As a result, changes can be made to certain aspects of the code or how it was run. The data collected by Remora can be used to improve code performance or detect issues (profiling and monitoring). Additionally, users can go back and examine their resource usage, in the event that something changes in the application or at run time.
Moreover, the information can be used by administrators to understand how users are utilizing resources. For example, the information can be used to determine how many cores, how much memory, how much I/O, and so on were used while running an application. This information can be used to adjust how resources are scheduled.
The keys to Remora are its simplicity, itsuse of commonly installed tools, and its focus on the user that puts data and information in the user's hands. The data can also be used by admins in a collective way to understand how the system is being used.
Data Streams
The key focus of Remora is to provide a run-time resource monitoring tool for users. It provides high-level information and detailed statistics to the user when an application is executed. This data is collected and put into a subdirectory, along with an HTML file that can be used for plotting the results.
Remora collects several streams of information:
- Memory usage (CPUs, Xeon Phi, and Nvidia GPUs)
- CPU utilization
- I/O usage (Lustre, DVS)
- NUMA properties
- Network topology
- MPI communication statistics
- Power consumption
- CPU temperatures
- Detailed application timing
To capture all of this information, Remora uses SSH to connect to all of the nodes used by the application. It spawns a background task on each of these nodes and regularly captures the data. However, the I/O data is only captured on the master node of the application.
No special applications are used by Remora to gather the information. Rather, existing tools are used, along with information parsedin the /proc/ table. A partial list of the tools and data sources used includes:
- numastat
- mpstat (a personal favorite)
- nvidia-smi
- ibtracert
- ibstatus
- xltop
- python
- /proc/meminfo
- /proc/[pid]/status
- /proc/sys/lnet/stats
- /sys/class/infiniband
Remora uses these tool and data sources to collect information within a specific interval while the application runs. It only collects the information associated with the application. In the case of message-passing interface (MPI) applications, it grabs the host node list of environment variables and uses that to ssh into the nodes and gather data.
When Remora is finished, it creates a directory in the form remora-XXX in the directory in which the application was run. Subdirectories contain the raw data, and an HTML page lets you examine and plot the data.
When run, Remora collects data from as many sources as it can find. For example, if it detects that Lustre is installed, it will grab data for that. If it detects the presence of an InfiniBand network, it will collect data for that. If it doesn't detect a source, it can’t gather data for it or create a chart.
Installing Remora
Installing Remora is not difficult; the approach is slightly different from the usual ./configure; make; make install. You also need to be aware that because Remora can provide MPI statistics, you need to build it with the intended version of MPI (i.e., don’t cross MPIs). I built Remora with the command,
REMORA_INSTALL_PREFIX=/home/laytonjb/bin/remora-1.8.2 ./install.sh
which installs to a directory in my home account. If more than one user is to have access, you can install Remora in a common directory.
If you use multiple versions of MPI, you need to build Remora for each version. If you are using environment modules (e.g.,Lmod), you can write a module for Remora, so it is added to the environment when the corresponding MPI module is loaded.
Using Remora
Remora is very simple to use: Just prepend it to your original command. For example, a simple command line for application ./myapp.exe would become:
$ remora ./myapp.exe
In the case of MPI code, a command line would be something like
$ remora mpirun ... ./mpiapp.exe
if the original command was mpirun … /mpiapp.exe. Notice that both commands are run as user, not root, which goes back to the design of Remora: a focus on users and providing them with useful information.
This next example is Fortran 90 code for a simple serial Poisson solver for a rectangular grid (poisson_serial.f90). Remora captures data every 10 seconds by default, so you need to adjust a few application parameters in the Fortran programfor a longer run time:
- nx = 8000
- ny = 8000
- it_max = 10000
- tolerance = 0.00004D+00
The code was compiled using GCC 7.1 and run on a four-core AMD A6-6310 laptop (Lenovo-G50-45). The output from the code and a summary from Remora are shown in Listing 1. Notice that it gives you the maximum memory used per node, as well as the run time of the application and the sampling time. It also lists the directory with the Remora output.
Listing 1: poisson_serial.f90 Output
[laytonjb@laytonjb REMORA_TEST]$ remora ./poisson_serial
23 August 2017   7:12:50.609 PM

POISSON_SERIAL:
  FORTRAN90 version
  A program for solving the Poisson equation.

  -DEL^2 U = F(X,Y)

  on the rectangle 0 <= X <= 1, 0 <= Y <= 1.

  F(X,Y) = pi^2 * ( x^2 + y^2 ) * sin ( pi * x * y )

  The number of interior X grid points is     8000
  The number of interior Y grid points is     8000
  The X grid spacing is     0.0001
  The Y grid spacing is     0.0001
  RMS of F =    5.99663
  RMS of exact solution =   0.622184

  Step    ||Unew||     ||Unew-U||     ||Unew-Exact||

      0    0.111796E-01                    0.622083
      1    0.115237E-01    0.279491E-02    0.622039
      2    0.119603E-01    0.156240E-02    0.622010
      3    0.123543E-01    0.113207E-02    0.621986
      4    0.127060E-01    0.904517E-03    0.621966
      5    0.130230E-01    0.761265E-03    0.621948
      6    0.133121E-01    0.661767E-03    0.621931
      7    0.135782E-01    0.588130E-03    0.621916
      8    0.138253E-01    0.531152E-03    0.621901
      9    0.140562E-01    0.485586E-03    0.621888
     10    0.142734E-01    0.448208E-03    0.621875

...

    246    0.266937E-01    0.402086E-04    0.620868
    247    0.267182E-01    0.400864E-04    0.620866
    248    0.267427E-01    0.399651E-04    0.620863
  The iteration has converged,

POISSON_SERIAL:
  Normal end of execution.

23 August 2017   7:21:31.215 PM

=============================== REMORA SUMMARY ===============================
 Max Memory Used Per Node     : 31.55 GB
*** REMORA: WARNING - Free memory per node close to zero.
 Total Elapsed Time           : 0d 0h 8m 40s 632ms
==============================================================================
 Sampling Period              : 10 seconds
 Complete Report Data         : /home/laytonjb/REMORA_TEST/remora_1503529969
 Graphical Results At         : /home/laytonjb/REMORA_TEST/remora_1503529969/reora_summary.html
==============================================================================
Remora creates a subdirectory to contain the system information over time. For this particular test, that subdirectory is remora_1503529969, in which I find a number of subdirectories with the raw data. Although you can parse the data in your subdirectories if you like, Remora creates a web page (HTML) that plots the data for you and is the easiest way to get a quick glimpse of what happened during application execution. Just open the web page in your favorite browser (Figure 1).
Figure 1: Summary web page.
The summary page lists the system metrics that Remora is capable of monitoring. A link below the metric means the corresponding data is available. Notice that for this simple case, only some of the metrics have been monitored. If you click the first link under "cpu utilization," you will see the plot in a new tab (Figure 2).
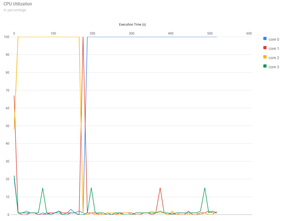
Figure 2: CPU utilization.
This laptop only has four cores, and Remora monitored all of them. Notice that the kernel moved the application from core 2 to core 1 (very briefly), and then to core 0 around 170–180 seconds into the run. The other cores don't run much of anything except system tasks.
The next obvious plot to examine is memory utilization (Figure 3), which includes the following:
- TMEM (Max): Maximum total memory (takes into account the memory not being used by the application, the libraries needed by the application, and the OS).
- MEM (Free): Free memory.
- SHMEM: Shared memory (/dev/shm). Applications have access to shared memory by means of /dev/shm. Any file put there counts toward the memory used by the application.
- RMEM: Resident memory – physical memory used by the application.
- RMEM (Max): Maximum resident memory.
- VMEM: Virtual memory (important to watch if the OOM killer kicks in)
- VMEM (Max): Maximum virtual memory.
These memory metrics are gathered from /proc/[pid]/status and /dev/shm.
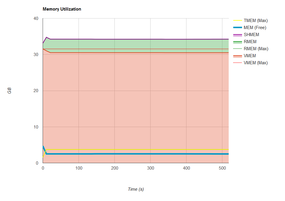
Figure 3: Memory utilization.
Summary
There are tools to do in-depth application profiling and there are tools to do system monitoring, but typically these tools are used by administrators or software developers. However, users are closest to their applications and know the specific problems that need to be solved, so putting tools into their hands can reap great results.
Remora is a superb tool for users that will help them get an idea about the resource usage of their application. It's not profiling, but a combination of profiling and system monitoring. Moreover, it’s easy to install, fairly light on resource usage, and can be a great help to users.
Tags:
![]() monitoring ,
monitoring , ![]() monitoring ,
monitoring , ![]() profiling ,
profiling , ![]() remora
remora