« Previous 1 2
An introduction to a special tool for transforming data formats
Data Lego
Databases
The described procedure should work for all jobs: Components are selected from the right, dragged onto the assembly area, and connected according to the data flow. Double-clicking the icon lets you configure each component. In the final step, run the entire assembly.
The input and output need not be only text files, Excel spreadsheets, or JSON files; they can also be a wide variety of databases, including MySQL, Oracle, MS SQL Server, PostgreSQL, SQLite, Sybase, Ingres, Informix, and others.
Creating a database is as easy as changing the converter from the Excel component to a database component. The Excel spreadsheet that has already been used now serves as the data source. The example in Figure 5 outputs the data to a MySQL database. If the database table does not exist, it can be generated on the fly.
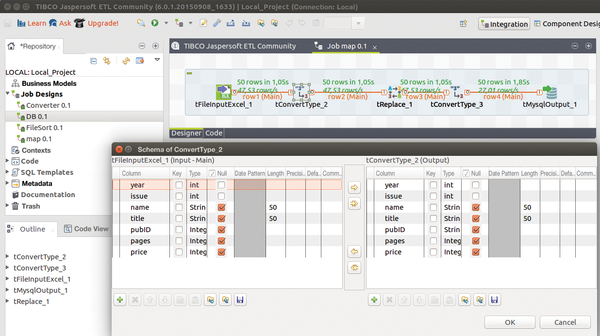 Figure 5: In this Excel import, the publisher ID (pubID) is replaced if it meets a certain criterion. A data type is converted temporarily for this to work.
In principle, it would suffice to use tFileInputExcel and tMySQLOutput components one after the other for the database export. When making the connections, you should try to avoid storing the complete name of the publisher in every line and instead place notations in a separate table, so that only the publisher ID (a number assigned before importing to the database) appears in the review table.
Another issue to consider in the example used here is that books were published by both Galileo Publishing and Rheinwerk Publishing House under different IDs, even though they are the same publisher that has changed its name. Consequently, the administrator will want to change all of the IDs with the value 6 (Galileo) into IDs of value 15 (Rheinwerk), which indicates the current name of the publishing house. The tReplace component performs this task.
However, this component only works with string values. This means that another component, tConvert, needs to be used to first convert all of the integer values in the pubID column of the review table into strings. After the Galileo IDs have been replaced, the tConvert component converts them back to an integer value, which is then loaded into the database.
Similarly, it is possible to use database tables as a data source. The next example illustrates how to use database tables as a source. The example generates a report that shows the number of books from each publisher. The output should not include any publisher IDs, just the name in plain text, which is accomplished in the database by a join operation:
SELECT publisher.name AS publisher, COUNT (reviews.pubID) AS number FROM publishers, reviews WHERE publishers.id = reviews.pubID GROUP BY reviews.pubID, publishers.name;
It is possible to create this kind of join operation directly in the SQL SELECT statement or in Jaspersoft ETL with the tJoin components.
If you want to compute the operation with a somewhat complicated SQL statement and insert the result in a longer chain of components, it is advisable to test the SQL command beforehand. The ETL framework allows you to do this directly. The tlogRow component provides support and displays arbitrary intermediate results (Figure 6).
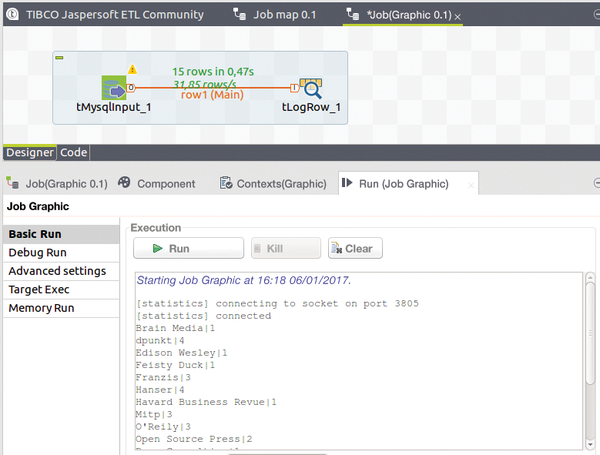 Figure 6: The tlogRow component logs arbitrary intermediate results.
The ETL tool can even generate a chart from the data with the tBarChart component, which, however, cannot be connected directly to the tMysqlInput component because it expects three specific column names: series, category, and value. The fix for discrepancies between the component and the input is to use the versatile tMap, which helps map the existing column names of the review table to the column names expected by the chart generator (Figure 7) and which also mapped publisher names to publisher IDs in an earlier process not described here.
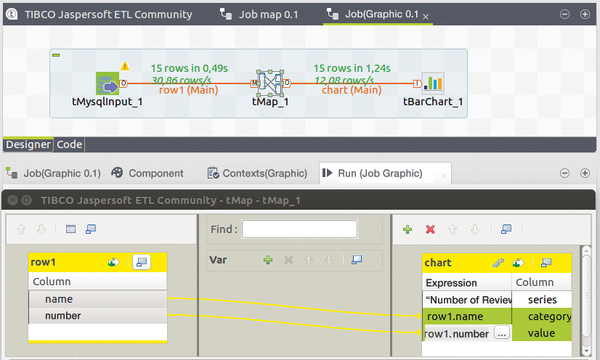 Figure 7: The chart generator requires particular column names in its data source. The mapping component makes it possible to set things up according to this requirement.
Conclusion
The examples shown here have purposefully been kept simple, because the goal is to understand the working principles. Once you know the principles, assembling relatively simple components to create complex processing procedures is straightforward.
Many of the filtering and sorting tasks can be performed by other means, as well, including Perl and Python scripts, database commands, or even Unix tools like grep and sort. The appeal of the Jaspersoft tool is that it offers a unified framework for a large class of tasks, most of which can be programmed visually, while integrating a large number of databases and business applications.
It is easy to lose sight of the whole picture with the multitude of ETL components, including interfaces for customer relationship management (CRM) systems like Sugar CRM, Vtiger, and Microsoft CRM; content management system (CMS) applications and document administration like Alfresco; business process management (BPM) tools like Bonita; business intelligence software like the in-house Jasper suite or SAP; enterprise resource planning (ERP) software like Sage X3 and Openbravo; statistical software like SPSS; and dozens of database types.
It is possible to integrate cloud storage, like Amazon's S3, Dropbox, and Google Drive. Components can be active over the Internet to send email, make HTTP requests, invoke web services, use the SOAP protocol, or create interfaces for standards that apply to data in business transactions like EDIFACT and HL7 for health care data.
Additionally, numerous generic components are available for input and output to and from files and streams with any number of formats, as well as components for converting, filtering, aggregating, searching, and replacing entries. Yet other components let you debug jobs and log messages and results. In the event that the above-mentioned resources are not sufficient for what you have in mind, you can even program your own components in Java.
Infos
- Jaspersoft ETL: http://community.jaspersoft.com/project/jaspersoft-etl
« Previous 1 2
Buy this article as PDF
(incl. VAT)
Buy ADMIN Magazine
US / Canada
UK / Australia
Related content
-
Workflow-based data analysis with KNIME
 They say data is "the new oil," but all that data you collect is only valuable if it leads to new insights. An open source analysis tool called KNIME lets you analyze data through graphical workflows – without the need for programming or complex spreadsheet manipulation.
 -
Mailman 3.0 – a long time coming
 Mailman 3.0 is a new major version, released 15 years after version 2.0. We put the new version through its paces and explain the installation procedure and new features.
 -
Apache Storm
 We take you through the installation of a Storm cluster and discuss how to create your own topologies.
 -
Legally compliant blockchain archiving
 Unite multiple data warehouses and data silos set up for ERP, tax compliancy, and EAI/ESB processes with blockchain-archived data.
 -
Discover ransomware with PowerShell
 Simple backup strategies cannot protect files encrypted by ransomware, because they can be affected as well. A PowerShell script can ensure that your files are okay before sending them to backup.
Subscribe to our ADMIN Newsletters
Subscribe to our Linux Newsletters
Find Linux and Open Source Jobs
Most Popular
Support Our Work
ADMIN content is made possible with support from readers like you. Please consider contributing when you've found an article to be beneficial.
