« Previous 1 2
HPC resource monitoring for users
Close Companion
Example 2
Example 2 is basically the same as Example 1, but it uses the OpenMP version of the Poisson solver [7]. In this case, all of the cores in the system are used.
Notice in Figure 5 that the application execution time with OpenMP is much shorter when using four cores than when using one core. Figure 6 shows CPU usage versus time for Example 2. Remember, this is an OpenMP application running on all cores, which is reflected by 96%-100% core utilization during the entire run. Figure 7 shows the plot of memory usage and Figure 8 a plot of Ethernet during the application run.
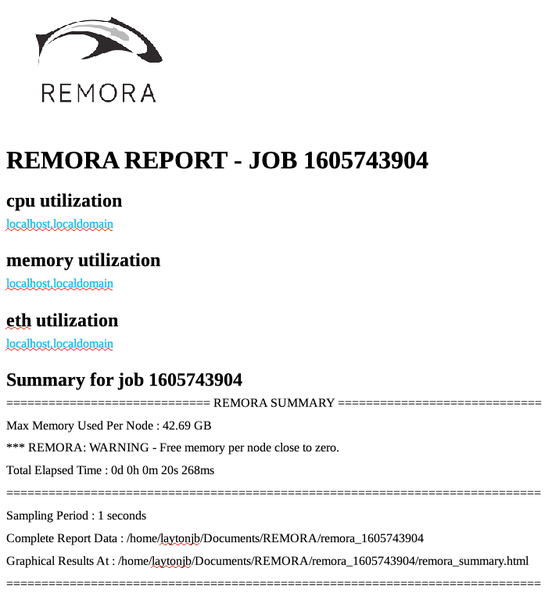 Figure 5: Remora output for Example 2.
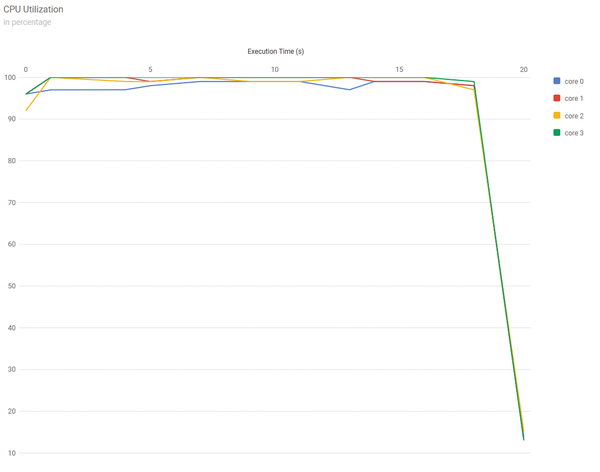 Figure 6: Example 2 CPU utilization plot.
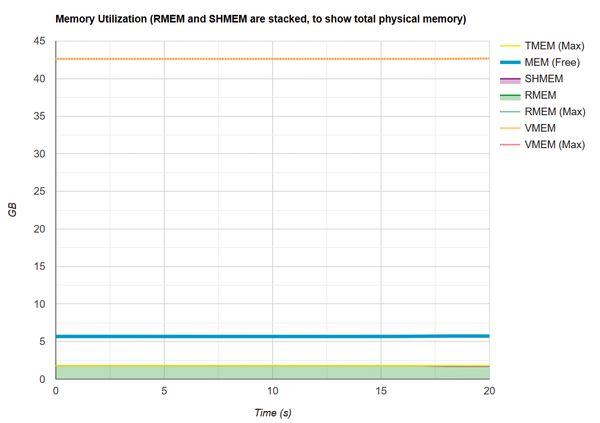 Figure 7: Example 2 memory utilization plot.
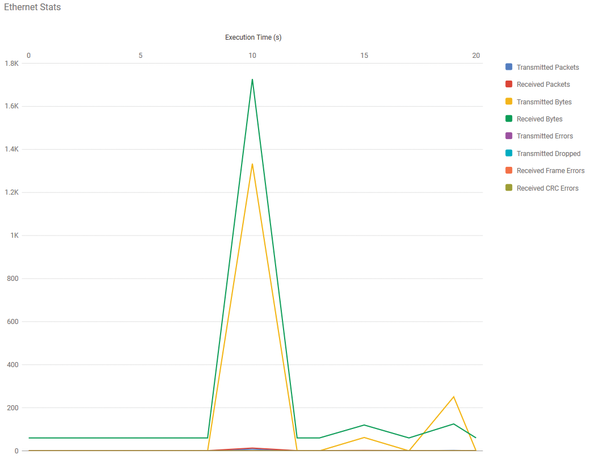 Figure 8: Example 2 Ethernet utilization plot.
Summary
HPC admins are always looking for better ways to monitor the systems for which they are responsible by understanding how the hardware is operating and seeing how user applications are performing. Many tools and techniques – both hardware and software – are available for monitoring systems. Even though you can find tools and techniques to coordinate monitoring with resource managers (job schedulers), all of these are administrator-oriented tools.
Users have precious few tools to monitor the resources their applications are using. With this "application telemetry" information, users can understand the pattern of their application, whether it seems to be performing correctly or incorrectly, what resources they consumed, and how their application is balanced across several nodes in the system – or even a single node.
Remora from TACC can gather this information for you and create plots to help guide you to a better understanding of your application without affecting its performance. Typically, the system administrator installs Remora, but users can install it in their accounts, as well.
Tuning the Remora installation is possible, particularly around what is monitored. Once installed, you just put the command remora before the command that runs the application, and you start gathering information. A few environment variables adjust how Remora gathers the data, but for the most part, it just silently gathers the data for you.
Remora is a great tool for users who want an idea of their application resource usage. Not pure profiling, Remora is really a combination of profiling and system monitoring. Easy to install and fairly light on resource usage, Remora can be a great help to users.
Infos
- Telemetry: https://www.multiformtech.co.uk/telemetry
- Remora: https://github.com/TACC/remora
- mpiP: https://github.com/LLNL/mpiP
- Lustre: https://www.lustre.org
- "Resource Monitoring For Remote Applications" by Jeff Layton, HPC , September 2017: https://www.admin-magazine.com/HPC/Articles/REMORA
- Lmod: https://github.com/TACC/Lmod
- POISSON_OPENMP: https://people.sc.fsu.edu/~jburkardt/f_src/poisson_openmp/poisson_openmp.html
« Previous 1 2
Buy this article as PDF
(incl. VAT)
Buy ADMIN Magazine
US / Canada
UK / Australia
Related content
-
Remora – Resource Monitoring for Users

Remora provides per-node and per-job resource utilization data that can be used to understand how an application performs on the system through a combination of profiling and system monitoring.
-
REMORA

Remora combines profiling and system monitoring to help you get to the root of application problems by revealing its use of resources.
-
Resource monitoring for remote applications
 Remora combines profiling and system monitoring to help you get to the root of application problems by revealing its use of resources.
 -
What to Do with System Data: Think Like a Vegan

What do you do with all of the HPC data you harvested as a lumberjack? You think like a Vegan.
Subscribe to our ADMIN Newsletters
Subscribe to our Linux Newsletters
Find Linux and Open Source Jobs
Most Popular
Support Our Work
ADMIN content is made possible with support from readers like you. Please consider contributing when you've found an article to be beneficial.
