« Previous 1 2
Measuring the performance health of system nodes
Peak Performance
Acceptable Performance
The EP and FT tests measure performance. The next question to answer is: What is acceptable performance? The answer to this question will vary from site to site and from person to person, but I will discuss my ideas.
You can't set acceptable performance by running benchmarks one time. You need to run them several times. For example, I would run each test a minimum of 21 times and collect the runtimes so that I can find any variation in the runs.
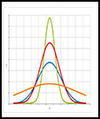
Next, I would compute the mean and standard deviation (SD) from the runtimes for each benchmark. To determine a cut-off value for performance, you should look at your distribution of runtimes. With a normal distribution (Figure 1), I don't care whether the performance is better than the mean, so I can ignore any performance cut-off to the right of the mean. (On the other hand, if the node performance is significantly better than the mean, you might want to try to understand why it is performing so much better than the others.)
 Figure 1: Normal distribution, with each band having a width of 1 standard deviation. Attribution 2.5 Generic (CC BY 2.5).
The lower bound of performance, or the left-hand portion of Figure 1, is of most interest. As always in HPC, acceptable performance varies from site to site and from person to person, but I choose to cut off the lower limit of performance (LLP) at
LLP = mean – 1/2(SD)
because 1 SD allows for a 34.1% reduction [8] in performance (assuming a normal distribution). One-eighth of a standard deviation is 4.78% of normally distributed data or 95.22% of the mean, allowing for benchmarks 4.78% below the mean. If you select a standard deviation fraction of 0.01, then the minimum value is 96.02% of the mean.
To me, if I see more than a 5% drop in performance compared with the mean, I should probably start looking at the offending node. The problem could be noisy system processes, a user application that doesn't close correctly, or even incorrect DIMM or CPU replacements that don't match the speeds of the others.
Benchmark Process
Running health performance checks before a user application definitely sounds like the use of a prolog [1] in the resource manager, because prolog scripts run before a job. The prolog script can be almost anything: Just write the code as a Bash script, from which you can call scripts written in other languages such as Perl or Python, run applications, or execute Bash commands. Because prologs are run as root, be careful. For example, to run the EP benchmark use:
time mpirun -np 6 -h ./hostfile ep.B.x
The output could be written to a random file in /tmp and parsed for the runtime.
The benchmark time is then compared with the mean minus one-eighth of the standard deviation. If the test value falls below this computed value, the node is marked down, and the user's job is resubmitted. The benchmark runtime along with the node name is added to a file or database for unacceptable runtimes and the admin is notified.
If the result is greater than the cutoff, you should write the benchmark time and node name to a file of acceptable results. This file should be used to recompute the mean and standard deviation for future benchmark testing.
Four implicit assumptions underlie the process:
1. The benchmark binary and all supporting libraries and tools must be available on every node in the cluster on which you run jobs.
2. You need a script to parse the output from the benchmarks. Although not difficult, you have to write it, nonetheless.
3. You have to establish two files (databases): one for storing the unacceptable results and the other for storing acceptable results.
4. You need a resource manager that uses a prolog before running a job. All the HPC resource managers that I know of have this capability.
Summary
Checking the health of a node is an important task for maximum utilization. I like to divide node health into two parts: state health and performance health. Both parts can run in a prolog script in the resource manager before the user's application executes. These scripts can either report the results to the admin or be used to check that the node health is acceptable for running the user's application.
To determine the state health of the node, you can write scripts to check on the various states, such as whether filesystems are mounted correctly, needed daemons are running, the amount of memory is correct, networking is up, certain system packages have the required version, and so on. NHC is a great tool for checking the state of a node, with a wide range of tests. NHC is in production at several sites, some of which are very large. The tool has been well tested over several years and is easy to use. If you don't want to write your own prolog scripts, NHC is definitely the tool of choice.
The performance aspect of node health is often ignored in HPC system. I summarized some aspects of this health check with the use of standardized benchmarks. In particular, the NPB benchmarks were used as a basis for checking whether a node is performing well by testing various aspects of a system. These tests have been available since about 1992, are well understood, stress various aspects of the system, and are very easy to compile.
By running the NPB benchmarks on the nodes of an HPC system several times, you can then determine the mean and standard deviation for the system. Then, you run the benchmarks on a node as part of a resource manager prolog to measure performance and compare the result with the mean and standard deviation of the system. If the results for the node are less than a desired value, the node is marked down and the user's job is resubmitted.
Determining a node's performance health before running a user's job can help both the user and the admin by reducing the number of questions around why an application might not be performing well. I hope this article has stimulated some ideas for measuring the performance health of your system.
Infos
- "Prolog and Epilog Scripts" by Jeff Layton: https://www.admin-magazine.com/index.php/HPC/Articles/Prolog-and-Epilog-Scripts
- Node Health Check: https://github.com/mej/nhc
- NASA Advanced Supercomputing (NAS) Parallel Benchmarks: https://www.nas.nasa.gov/software/npb.html
- NAS Parallel Benchmarks Wikipedia: https://en.wikipedia.org/wiki/NAS_Parallel_Benchmarks
- Benchmark document: https://www.nas.nasa.gov/assets/pdf/techreports/2003/nas-03-010.pdf
- NPB-GPU: https://github.com/GMAP/NPB-GPU
- NPB-CUDA and NPB-MZ-CUDA: https://www.tu-chemnitz.de/informatik/PI/sonstiges/downloads/npb-gpu/index.php.en
- 1SD Reduction: https://www.mathsisfun.com/data/standard-normal-distribution-table.html
« Previous 1 2
Buy this article as PDF
(incl. VAT)
Buy ADMIN Magazine
US / Canada
UK / Australia
Related content
-
Performance Health Check
Many HPC systems check the state of a node b efore running a n application, but not very many check that the performance of the node is acceptable before running the job.
-
Benchmarks Don’t Have to Be Evil

Benchmarks have been misused by both users and vendors for many years, but they don’t have to be the evil creature we all think them to be.
-
Using benchmarks to your advantage
 A collection of single- and multinode performance benchmarks is an excellent place to start when debugging a user's application that isn't running well.
 -
Prolog and Epilog Scripts

HPC systems can benefit from administrator-defined prolog and epilog scripts.
-
ClusterHAT

Inexpensive, small, portable, low-power clusters are fantastic for many HPC applications. One of the coolest small clusters is the ClusterHAT for Raspberry Pi.
Subscribe to our ADMIN Newsletters
Subscribe to our Linux Newsletters
Find Linux and Open Source Jobs
Most Popular
Support Our Work
ADMIN content is made possible with support from readers like you. Please consider contributing when you've found an article to be beneficial.
