The Doctor Is In
One of the main problems with regular port scans on a large network is the overhead: Depending on the number of servers, the list of open ports can quickly scale to a point that is impossible to track manually. Watching the whole network requires careful, and thus very time consuming, scrutiny of the scan results, and in many cases, you will not have the staff to expend the necessary attention. Additionally, many organizations lack a precisely defined, centrally available target state with which to compare the results, especially if individual departments are allowed to set up their own servers and services.
If you use different scanner locations to analyze your networks (e.g., one location within the organization and one across the Internet), you also face the problem of interpreting different lists of results. Inconsistencies arise because of connections blocked by firewalls and scans occurring at the different times. Reconciling the results requires manual evaluation.
An open source tool known as Dr. Portscan can help you automate distributed port scans and their evaluation. Dr. Portscan is a delta reporting tool that can assist almost any port scanning tool in analyzing parallel or staggered scans of arbitrarily overlapping networks. The results of these scans are automatically aggregated and compared. Changes discovered in the process can be added to reports for various target groups or passed into scripts as parameters. This approach opens up advanced diagnostic options, including the ability to compare the results with a defined target state.
In this article, we examine the general structure of distributed port scan infrastructures, the architecture and functionality of Dr. Portscan, and the basic steps for commissioning Dr Portscan to keep watch over your network.
Distributed Port Scans
If you are looking for authoritative results from the port scanning process, you’ll need to ask yourself the following questions:
- What port scanning tools will you deploy? In addition to the classic Nmap tool, you will find numerous other free and commercial scanners. Security and network management tools can deliver information about open ports either explicitly or implicitly and thus serve as data sources.
- How many systems will run port scans? Multiple port scanners at different locations let you differentiate between internal and external views of the networks you analyze.
- How often will you launch scans from these systems? You need to take into consideration that some Internet-based port scanning services only envisage fixed intervals.
- What is the scope of the scan? External port scans are typically slower than internal LAN scans. For this reason, you might want to restrict scans to individual subnets, or some other subset of all possible TCP/UDP ports.
- How can you validate the ports detected as being open; that is, how can you compare this with a target state? Besides an initial scan with subsequent manual checks, you might be able to retrieve a target state documented in an asset database or a configuration management system.
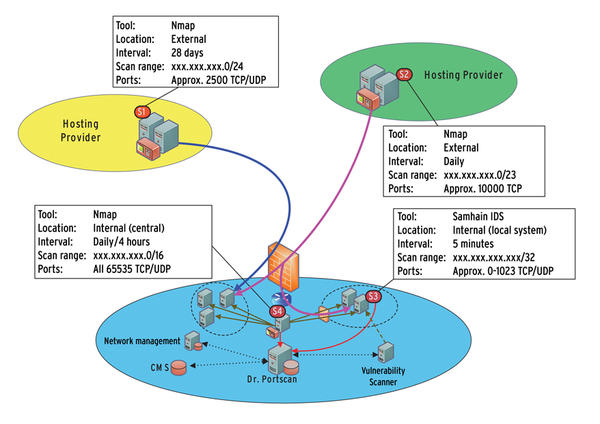
Figure 1 shows a somewhat simplified view of a typical scenario for using Dr. Portscan.
The scripts on which Dr. Portscan is based let you compare an arbitrary number of port scan result lists created by different computers. (The popular Ndiff tool lets you compare exactly two Nmap scan results.)
Figure 2 shows the system architecture of Dr. Portscan with its most important components.
Data sources (1) can be any port scanning tools. Agents (2) are responsible for converting the product-specific scan results into a uniform format. The input agent for Nmap, for example, contains parsers for XML and grepable Nmap output as of version 5. The overhead for implementing additional input agents depends on the port scanning tool you need to integrate, but it is typically reasonable because the code segments you need to modify simply consist of a list of the detected IP addresses and open ports. The delta reporter (3) transfers the results delivered by the input agents to a database (4), which stores and evaluates the results of all port scans. The information generated in the process indicates changes compared with recent scans.
Freely definable output agents (5) can provide an overview, create reports about changes on the individual subnets, mail information to the administrator in charge, or trigger arbitrary scripts to retrieve more information about the service hiding behind the newly opened port.
Dr. Portscan is designed to serve as a centralized relational database, initially to collect the results of the decentralized port scans in a uniform format. Because the input agents, the delta reporter, and the output agents are all implemented in Perl, you can use a wide spectrum of open source and commercial database products. The minimal sample configuration relies on SQLite. This sample configuration makes it easy to try out Dr. Portscan without having to set up a database server and a new database. For larger installations, it makes sense to use MariaDB, PostgreSQL, or some other relational database management system for which the Perl DBI modules are available.
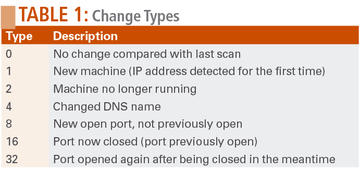
The database stores all the information for every scanned machine and every port that has drawn attention to itself. The most important thing to watch is the changes compared with the last port scan run for the same entry. Table 1 shows the supported change types.
Data Sources and Input Agents
The port scanning tools (or data sources , as they are known in Dr. Portscan) are initially configured independently of the input agents. For example, you could automatically run nmap as a cronjob once a day on a Linux machine to scan all the ports in a network range equivalent to a legacy Class B network:
/usr/bin/nmap -v -v -oG - -p 1-65535 10.1.0.0/16 > /tmp/nmap-results.txt
Each data source is assigned to an input agent; its main task is to generate a list of all IP address and port pairs detected as open by the data source. The agent reads and parses the output from the scan tool. The preceding call to Nmap would return the following text output on a web server:
Host: 10.1.123.123 (www.example.com) Ports: 80/open/tcp//http///, 443/open/tcp//https/// Ignored State: filtered
The results from the input agent – a simple text file with an IP address, a port, the protocol details, and an optional timestamp in each line – are then either deposited for the delta reporter to pick up or pushed to another system (e.g., using scp ). This intermediate step is often necessary because the SQLite database used by Dr. Portscan in the default configuration (without add-on software such as cubeSQL) is not accessible on the network and because other databases are often hardened against Internet access by a firewall, thus preventing direct entry of the results in a central database.
Delta Reporter, Output Agents, and Reports
The delta reporter first transfers the port scan results returned by the input agents to the central database. The reporter checks for each IP address and port pair, taking into consideration the Layer 4 protocol, whether an entry for the current scanner already exists, or whether a new entry needs to be created. When existing entries are updated, the appropriate change type is set.
After all the port scan results have been imported, the output agent can evaluate the central data repository. Because changes compared with the status quo are of primary interest, output agents typically only look for database entries with specific change types. To prevent an output agent from processing the same entry multiple times, the agent enters its own identifier in the corresponding column of the database table.
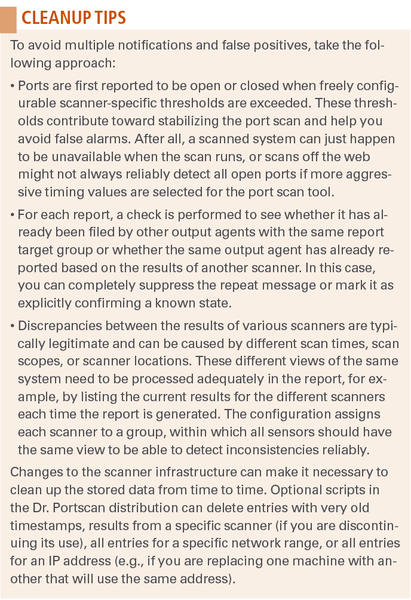
To suit your own needs, you should modify the number and type of output agents. Dr. Portscan offers a preconfigured output agent that gives you an overview of all changes since the last report, but you can restrict evaluation by the output agents in a targeted way. For example, you might just want to see the results for specific subnets or specific events (e.g., newly opened ports) to compare these results with a defined target state. The box titled “Cleanup Tips” describes some steps for ensuring a readable result.
Installation and Commissioning
The following installation description assumes that the delta reporter, the output agents, and the database are installed on the same machine. The scanners may run on different systems as long as they are capable of transferring their scan results to the central delta-reporting instance.
The current version of Dr. Portscan is available from a Git repository. As an alternative to downloading from your web browser, you can retrieve the complete repository as follows:
git clone git://git.lrz.de/DrPortScan.git
The preconditions for running the simplest installation variant are SQLite3, Perl, and the following Perl modules, which you can install via CPAN along with their dependencies: DBI, XML::LibXML, XML::Validate, Socket, DateTime, DateTime::Format::Strptime, File::Basename, File::Copy, File::Find, Curses::UI, Net::DNS::Resolver, NetAddr::IP.
To launch the install, call the setup.pl script, which checks to see whether the required Perl modules are in place. If the modules are not in place, you will see an error message stating which modules you need to install. Additionally, the script handles the task of creating the directory structure for the input and output files, which is also necessary for running Dr. Portscan. To create and initialize an SQLite database, call the create_db.sh script. After creating the database, the script also registers a number of test scanners, which you can use as templates for your own scanner definitions. If you prefer not to use this option, you can manage the scanners later on using the configuration.pl script. In addition to listing the scanners currently registered in the database, this script also lets you enter new scanners and modify or remove existing scanners.
Scanning
Consider the following example, which relies on the standard scanning tool Nmap. Dr. Portscan already comes with a preconfigured Nmap input agent. For an Nmap scan with detailed XML output, use the following command:
nmap -oX /<path>/<to>/<file>/nmap-xml_scanner_timestamp.xml <IPrange>
If Dr. Portscan does not provide a matching input agent, you need to develop an agent for your own scanner software; you can use the existing template as the basis for your development.
You need to transfer the scan output to the Dr. Portscan input folder on the central machine. The output filename must follow a specific pattern to help identify the input agent responsible for processing the file. You also need to state which scanner the file came from and when the scan was performed. The scanner ID is the same as the ID used to register the scanner with the centralized database, and the date must use the YYYYMMDDHHMMSS format; thus, the filename looks like this: <input-agent>_<scanner>_<date>.* .
It isn’t important how the files make their way from the external scanners to the central delta reporting instance. If you want to restrict access to the delta reporting system, you can use rsync as a cronjob to retrieve new scan results.
Delta Reporting
The central component in Dr. Portscan is the delta reporting instance. The input-watcher.pl script checks to see whether new scan results are available for processing. The files are first sorted chronologically; then, the script finds the matching input agent, calls the agent to convert the files to a uniform data format, and sends the results to the delta reporter for ongoing processing. If this processing completes without error, the file is moved to the old directory; otherwise, it is moved to failed . (To make sure the input watcher script is run at regular intervals, create a cronjob.)
The delta reporter now compares the current results with those of the previous scan and enters the results in the database. The output agents then modify this output for further use. A first step in a typical application is the xml-out.pl output agent, which outputs the detected changes as an XML document. You can then convert the document to a plain-text version using the xml2plaintex.pl script and mail the results as needed. Alternatively, you can convert the XML document to HTML and view the results in a browser.
The Future of Dr. Portscan
Dr. Portscan is under active development; the next version will include a multitenant-capable configuration and reporting tool. This tool will allow administrators who are responsible for part of a network to define the scope of the scan and the boundaries of the report in a web front end. Additionally, reporting will be improved for IPv4/IPv6 dual-stack environments to help identify inconsistent IPv4 and IPv6 firewall rules. Also, the developers are working on an output agent for reporting port scan results to a security management system such as AlienVault OSSIM.
Subscribe to our ADMIN Newsletters
Subscribe to our Linux Newsletters
Find Linux and Open Source Jobs
Most Popular
Support Our Work
ADMIN content is made possible with support from readers like you. Please consider contributing when you've found an article to be beneficial.


