« Previous 1 2
Monitoring containers
On-Screen
When administrators monitor containers, they first need to consider what expectations they have with respect to the monitoring tool. Is it important to know the load the containers generate on the host resources, or is availability of the containerized services of more interest? Existing monitoring solutions can be used in part for both use cases.
Rough Overview
Docker [1] offers a variety of information related to the containers [2], but only as a starting point for tools with more complex monitoring approaches. Docker does not format the data, but it does support a couple of commands that at least allow administrators to establish rudimentary container monitoring.
The docker ps command lists all active containers – or those that have run – on a host (Figure 1). This command gives you a rough overview of whether containers are still running and an application is therefore available. Additionally, the command reveals other details, such as open and forwarded ports. If the system terminates an application, you get to see a return code.
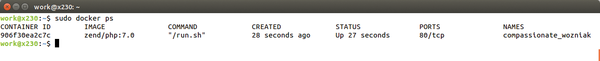 Figure 1: The docker ps command provides an overview of the active containers.
The docker logs
Buy this article as PDF
(incl. VAT)
Buy ADMIN Magazine
Related content
-
Goodbye virtual machines, hello container machines
 Keep your test-driven development and testing environments pristine with Footloose containers that look like VMs.
 -
Server administration with Cockpit
 Administer a small server farm, virtual machines, and the Docker alternative Podman with just a web browser.
 -
Graphical management solutions for Docker
 Thanks to graphical management interfaces for Docker, even newcomers can set up container environments without extended training.
 -
Grafana and time series databases
 We look at database back ends for monitoring, alerting, and trending analysis in the Grafana visualization tool.
 -
Dockerizing Legacy Applications
 Sooner or later, you'll want to convert your legacy application to a containerized environment. Docker offers the tools for a smooth and efficient transition.
Subscribe to our ADMIN Newsletters
Subscribe to our Linux Newsletters
Find Linux and Open Source Jobs
Most Popular
Support Our Work
ADMIN content is made possible with support from readers like you. Please consider contributing when you've found an article to be beneficial.
