« Previous 1 2 3 4 Next »
Time-series-based monitoring with Prometheus
Lighting Up the Dark
Target Practice
Monitoring only yourself doesn't make much sense. Targets for Prometheus are stored in the prometheus.yml file. If the file is not in the program directory, you can pass in the path to the file to your distributed monitoring system with the -config.file option. To query the metrics of a node_exporter running locally, you would add the following definition to the scrape_configs section:
- job_name: 'node'
  static_configs:
    - targets: ['localhost:9100']
You can add more instances by expanding the list of targets (e.g., ['localhost:9100', '10.1.2.3:9100', …]). You can stipulate other types of jobs, such as instrumented applications or other exporters, as separate job_name sections.
Discovery
In environments with short-lived instances, such as Docker or Kubernetes, you would not copy the instances manually to a configuration file. Another Prometheus feature, service discovery, can help. The monitoring software independently discovers monitoring targets for Azure, the Google Container Engine (GKE), Amazon Web Services (AWS), or Kubernetes. The entire list, configuration parameters, and formats are available online [15].
File-based service discovery plays a special role: It parses all the pattern-matching files listed in prometheus.yml. Prometheus automatically detects changes to the files. With this mechanism, you can tap into configuration tools such as Ansible – only your imagination sets the limits.
Architecture
As a diagram of the project architecture shows [16], Prometheus takes care of querying the targets and saving the metrics in a (local) time series database. Furthermore, it comes with the intelligent PromQL query language that lets you query stored metrics for visualization, aggregation, and alerting.
Prometheus forwards alerts to the alert manager, which can deduplicate and mute the alerts (e.g., during maintenance windows). The manager then uses email, Slack, or a generic webhook to forward the alerts to the admin.
The Pushgateway is another component that fields and caches results from short-lived programs. Prometheus can receive metrics sent from batch jobs, as well.
To replace the built-in web interface referred to earlier, Grafana [17], which is not associated with the Prometheus project, can be used for more elaborate dashboards (see also the article on Grafana in this issue). Grafana is now regarded as the standard tool for visualization and dashboards and already offers a wide variety of prebuilt dashboards for Prometheus that you can import into your own Grafana installation [18]. Figure 3 shows one that I use to monitor my VDSL Internet connection [19].
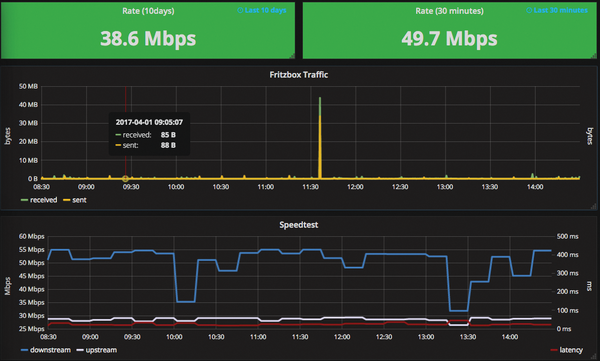 Figure 3: Example of a Grafana dashboard with Prometheus metrics.
« Previous 1 2 3 4 Next »
Buy this article as PDF
(incl. VAT)
Buy ADMIN Magazine
US / Canada
UK / Australia
Related content
-
Monitoring container clusters with Prometheus
 In native cloud environments, classic monitoring tools reach their limits when monitoring transient objects such as containers. Prometheus closes this gap, which Kubernetes complements, thanks to its conceptual similarity, simple structure, and far-reaching automation.
 -
Getting started with Prometheus
 Prometheus is a centralized time series database with metrics, scraping, and alerting logic built in. We help you get started monitoring with Prometheus.
 -
Monitoring, alerting, and trending with the TICK Stack
 If you are looking for a monitoring, alerting, and trending solution for large landscapes, you will find all the components you need in the TICK Stack.
 -
Make better use of Prometheus with Grafana, Telegraf, and Alerta
 The Prometheus monitoring tool might not always look like one of the Titans, but add-ons like Alerta or Telegraf can improve its looks.
 -
Detect anomalies in metrics data
 Anomalies in an environment's metrics data are an important indicator of an attack. The Prometheus time series database automatically detects, alerts, and forecasts anomalous behavior with the Fourier and Prophet models of the Prometheus Anomaly Detector.
Subscribe to our ADMIN Newsletters
Subscribe to our Linux Newsletters
Find Linux and Open Source Jobs
Most Popular
Support Our Work
ADMIN content is made possible with support from readers like you. Please consider contributing when you've found an article to be beneficial.
