System Accountant
Sar (System Activity Reporter) is an inconspicuous, small, command-line tool that originally comes from the System V world. Today, sar is indispensable for troubleshooting or tuning Unix/Linux systems. Not only does sar provide ad hoc information on many performance values, it also collects data incessantly and sorts it on a daily basis into organized binary logs.
Sar keeps seven logs by default, but it can also remember a month of events. On some operating systems, such as Ubuntu, archives reaching back even longer are possible. Thus, for each point of time in a past period, you can retrospectively determine CPU utilization or free RAM, the number of network packets transmitted, or the speed of disk I/O.
Installation
Sar is included in the repositories of all well-known Linux distributions, and the package is typically named sysstat . In addition to the binary, some scripts and cron entries need to be installed, including:
- sar : The sar command is used to display collected values.
- sadc : (System activity data collector) takes a predetermined number of samples at defined intervals.
- sa1 : A wrapper for sadc , the sal shell script passes various parameters to sadc and sends the returned data to the correct binary log. The logfiles usually reside in /var/log/sa or /var/log/sysstat (Ubuntu) and always go by the name sa<dd> , where dd is the day of the month. The script is usually called every 10 minutes by cron, although you can adjust the interval if you need more or fewer values.
- sa2 : This shell script rotates the daily log and compresses older logs on request. Sa2 is launched by cron once a day.
- sadf : An output program for data exchange, sadf processes collected data in various formats (e.g., database records, CSV, or XML).
After package installation, sar is ready for immediate use on RHEL/CentOS; on Debian/Ubuntu, you must first set the ENABLED variable to true in /etc/default/sysstat .
Then and Now
Table 1 shows the options that determine which values are output (Table 1).
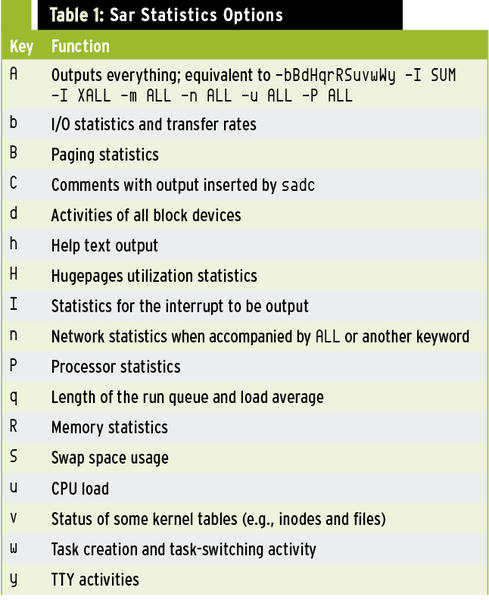
(You can find more information from the sar man page.) All of these values can be queried immediately, or you can set a querying interval with a maximum number of queries. For example, Listing 1 shows you how to get two CPU usage values in a 10-second cycle.
Listing 1: Query with Interval and Number
jcb@hercules:# sar -q 10 2
Linux 3.5.0-44-generic (hercules)         03.12.2013      _x86_64_        (2 CPU)

09:46:03      runq-sz  plist-sz   ldavg-1   ldavg-5  ldavg-15   blocked
09:46:13            1       468      0.02      0.06      0.14         0
9:46:23 AM          0       468      0.01      0.06      0.14         0
Average:            0       468      0.01      0.06      0.14         0
With the ‑f option, you can also specify a daily log from which to retrieve values, and ‑s and ‑e let you specify arbitrary start and end times (Listing 2).
Listing 2: Query with Log and Time Definitions
jcb@hercules:# sar -u -f /var/log/sysstat/sa02 -s 12:00:00 -e 13:00:00
Linux 3.5.0-43-generic (hercules)         02.12.2013      _x86_64_        (2 CPU)

12:05:01        CPU     %user     %nice   %system   %iowait    %steal     %idle
12:15:01        all      2.08      0.00      0.96      0.02      0.00     96.94
12:25:01        all      1.96      0.00      0.82      0.06      0.00     97.16
12:35:01 PM     all      1.22      0.00      0.73      0.00      0.00     98.05
12:45:01 PM     all      1.32      0.00      0.72      0.01      0.00     97.95
12:55:01 PM     all      1.79      0.00      0.75      0.05      0.00     97.41
Average:        all      1.67      0.00      0.80      0.03      0.00     97.5
Some implementations (e.g., SunOS) support a timex command that collects sar statistics parallel to a specified program as it runs, as in:
timex ‑s make bigprogram
On Linux, however, this feature is not available.
Reports
Once you have the wealth of performance data at your fingertips that sar collects, it naturally makes sense to evaluate it according to various criteria and visualize the results. In the simplest case, you could use a spreadsheet or gnuplot, but a number of specialized programs evaluate sar data as well.
For example, the ksar Java application, when called with the name of a logfile,
root@hercules:# java ‑jar kSar.jar ‑input 'cmd:///usr/bin/sar‑dwu ‑f /var/log/sysstat/sa02'
automatically produces graphs with user-chosen colors and backgrounds (Figure 1).
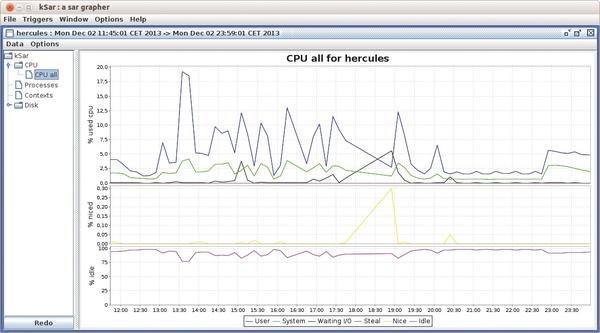 Figure 1: Freely customizable and zoomable graphics are the specialty of ksar.
You can interactively zoom into the graphs and export to a PDF and various graphic formats. Instead of a logfile, you could specify an SSH command that retrieves data from a remote machine.
The commercial SarCheck tool goes one step further. Although it has been around since 1994, the Linux version is still in development, and you can currently only buy versions for Solaris, HP-UX, and AIX. The beta test of the Linux edition was very promising according to the manufacturer.
SarCheck not only draws diagrams, it performs a complete resource analysis and automatically detects CPU and I/O bottlenecks, runaway processes, wrong I/O load balancing, slow hard drives, memory bottlenecks and leaks, and incorrect system buffer and table sizes. To do this, SarCheck works with threshold values for all measured parameters and actively suggests tuning recommendations.
Conclusions
Sar is an extremely useful and versatile data logger that can do more than just display instantaneous values. It keeps statistics for weeks and can produce information for any point in time of the period under review. Other programs, such as ksar, visualize sar output as graphs, whereas SarCheck even uses the information in sar logfiles for full-blown system diagnostics.
Related content
-
Collecting and evaluating performance data over a period of time
 Several utilities offer a snapshot of system performance – from Top or Uptime to Iostat, Netstat, and Mpstat – but what if you only learn of a bottleneck after it has happened? Sar to the rescue.
 -
Profiling application resource usage
 Computing hardware is constantly changing, with new CPUs and accelerators, and the integration of both. How do you know which processors are right for your code?
 -
First steps in IT automation by Rex
 Rex doesn't need agents or a special language to describe the tasks it performs on remote computers.
 -
Profiling Is the Key to Survival

Computing hardware is constantly changing, with new CPUs and accelerators, and the integration of both. How do you know which processors are right for your code?
-
Admin as a service with sysstat for ex-post monitoring
 The top, vmstat, and iotop monitoring tools for Linux show the current situation but do not provide any information about the past – which is where sysstat comes into play.
Subscribe to our ADMIN Newsletters
Subscribe to our Linux Newsletters
Find Linux and Open Source Jobs
Most Popular
Focus On Self-Hosting
• Self-Hosted Collaboration with Forgejo
• Self-Hosted PaaS with Coolify
• Build and Host Docker Images
• Self-Hosted Pritunl VPN Server with MFA
• Self-Hosted Chat Servers
Support Our Work
ADMIN content is made possible with support from readers like you. Please consider contributing when you've found an article to be beneficial.
