
The language you choose to use affects I/O patterns and performance. We track a simple write I/O pattern with C and look at how to improve performance.
Understanding I/O Patterns with strace, Part I
I’ve written articles in the past about I/O patterns and examined them using strace. This type of information comes from the perspective of the application – that is, what it sends to the OS. The OS then takes these requests and acts upon them, returning a result to the application. Understanding the I/O pattern from an application’s perspective allows you to focus on that application. Then, you can switch platforms or operating systems or distributions, or even tune the OS, with an understanding of what your application requests from the OS.
Ideally you want to write the I/O portions of the application so that I/O is not necessarily a bottleneck. This primarily means you want to do things to improve the throughput performance of the application. However, at the same time, the focus of the application developer is not necessarily just the I/O, but really the algorithm in the application. Consequently, application developers, myself included, tend to default to easy, simple ways to do I/O. But is this the best way to do I/O to achieve maximum I/O performance?
In this article, I start with a simple example in which a user-defined data structure (data type) is written to a file but is part of a loop. The data type is fairly simple: three integers and one float. Then, I want to run the application and examine it with strace to see how it does I/O. My goal is to understand what is happening in regard to the I/O and even how I might improve it by rewriting the application (tuning).
Believe it or not, the language and the compiler or interpreter have a great deal of influence on the resulting I/O pattern. The I/O pattern using C I/O is different from Fortran I/O and so on. In a series of three articles, I’m going to use three languages that are fairly common in HPC to illustrate these differences: C, Fortran 90, and Python (2.x series). I’ll be running the examples on a single 64-bit system with CentOS 6.2 using the default GCC compilers, GCC and GFortran (4.4.6), as well as the default Python (2.6.6).
With the use of a simple example in each language, I’ll then vary the number of data type elements to get an increasing amount of I/O. The strace output captured when the application is executed will be examined for the resulting I/O. By varying the number of elements, my goal is to see how the I/O pattern changes and perhaps better understand what is happening.
C Code
The reason I’m writing in straight C code and not C++ is because I still find a great deal of C in HPC. I’m not saying that C++ isn’t suited for HPC but rather that, from my perspective, I haven’t seen it as much as plain C. Therefore I’m going to write the example in C.
The basic algorithm is presented in Listing 1C. Simply, inside a loop, a data structure is populated with data. This is just the basic code; I add the I/O in Listing 2C.
Listing 1C: Basic C Code Example
 1  #include<stdio.h>
 2
 3  /* Our structure */
 4  struct rec
 5  {
 6     int x,y,z;
 7     float value;
 8  };
 9
10  int main()
11  {
12     int counter;
13     struct rec my_record;
14     int counter_limit;
15
16     counter_limit = 100;
17
18     for ( counter=1; counter <= counter_limit; counter++)
19     {
20        my_record.x = counter;
21        my_record.y = counter + 1;
22        my_record.z = counter + 2;
23        my_record.value = (float) counter * 10.0;
24        /* write out my_record */
25     }
26     return 0;
27  }
One-by-One
Initially, I’m just going to write out the data structure in the loop once it's populated. Listing 2C has the C code and the I/O function calls. Throughout this article, I refer to this I/O approach as “one-by-one.”
Listing 2C: C Code Example with Output in Loop (One-by-One)
1  #include<stdio.h>
 2
 3  /* Our structure */
 4  struct rec
 5  {
 6     int x,y,z;
 7     float value;
 8  };
 9
10  int main()
11  {
12     int counter;
13     struct rec my_record;
14     int counter_limit;
15     FILE *ptr_myfile;
16
17     counter_limit = 100;
18
19     ptr_myfile=fopen("test.bin","wb");
20     if (!ptr_myfile)
21     {
22        printf("Unable to open file!");
23        return 1;
24     }
25     for ( counter=1; counter <= counter_limit; counter++)
26     {
27        my_record.x = counter;
28        my_record.y = counter + 1;
29        my_record.z = counter + 2;
30        my_record.value = (float) counter * 10.0;
31        fwrite(&my_record, sizeof(struct rec), 1, ptr_myfile);
32     }
33     fclose(ptr_myfile);
34     return 0;
35  }
To begin, I set the variable counter_limit to 100 and look at the strace output when the application is executed. Getting the strace output is fairly easy with the following command because the code is single-threaded:
$ strace -T -ttt -o strace.out ./ex1
In this command line, the executable is named ex1, and the strace output is sent to the file strace.out with the -o option. You should look at the strace just out of pure interest (it’s not that hard to follow). For this simple code, strace outputs a number of lines, but I'm interested in the subset that corresponds to the I/O portion of the application. I'm going to grab the strace output lines that begin with the open() function for the file test.bin and end with the close() function (Figure 1C).
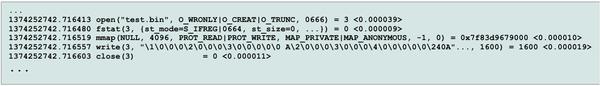 Figure 1C: Strace excerpt with C one-by-one code; 100 iterations.
Notice that the actual write function writes out 1,600 bytes (this is the number after the equals sign toward the end of the line). With 100 elements, each element is 16 bytes (1,600/100). Also notice that it took 0.000019 seconds to complete (this is the number in the <> brackets at the end of the line. Simple math says that the write throughput was 84.2MBps (1,600 byes/0.000019 seconds).
A significant part of the strace listing in Figure 1C is easy to gloss over. The application does a write for each data structure inside the loop (there are 100 of them). Wouldn't you think there should be 100 writes in the strace output? What has happened is that the fwrite() function in the code has buffered the output. That is, it saves all of the data until it reaches a certain size, or the file is closed, before issuing a write() function to the OS. In this case, it was able to buffer all of the write data into a single write() function call (1,600 bytes). This buffering can greatly improve performance by streaming the output to the OS rather than issuing a bunch of small 16-byte writes. Although buffering has a slight latency penalty and uses system memory, for this example, the data sizes are so small that latency isn't that noticeable and the system memory used for the buffering usually isn't that large. Even for large writes the latency won’t have a big effect on storage – it's usually driven by bandwidth performance.
Now I want to increase the number of elements in the application to see what happens to buffering and the write throughput. For the output shown in Figure 2C, I've increased the loop counter to 256.
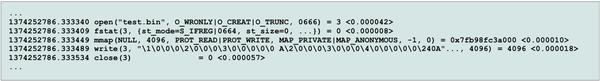 Figure 2C: Strace excerpt with C one-by-one code; 256 iterations.
Now the application has written 4,096 bytes in 0.000018 seconds. This is slightly greater than 227.5MBps. Also notice that at 256 iterations, the application still only uses a single write() function. Next, I’ll try 500 iterations (Figure 3C).
 Figure 3C: Strace excerpt with C one-by-one code; 500 iterations.
The first thing that strikes me in this strace output is that I’ve graduated from one write() function to two. The first writes 4,096 bytes, and the second writes 3,904 bytes. When I divide the total of 8,000 bytes by 500, I find that it has written 16 bytes per element (makes sense). The first write had a throughput of 151.7MBps, and the second write had a throughput of 260.7MBps.
The really interesting question is why did the buffering stop at 4,096 bytes? It turns out this is defined in stdio.h that comes with the GCC compiler. If you look start looking through the GCC header files, you will see that the buffer size is defined as 8,192 (twice 4,096), which is the limiting factor on the buffer size for the write I/O pattern I’m using.
Not to put too fine of a point on the testing, but now I’ll try 2,000 elements, just to see how many times the write function is called (Figure 4C).
 Figure 4C: Strace excerpt with C one-by-one code; 2,000 elements.
If you add up the data, you discover the application wrote 32,000 bytes (32KB) or 16 bytes per element. It took eight write() function calls to do this; the first seven are 4,096 bytes (4KB), and the last is 3,328 bytes. That is a very small amount of data per write function. In fact, 4KB is typically used as the size when testing IOPS performance (i.e., very small writes). However, I’m writing 32KB, which is still small but definitely not as small as 4KB. If one were to look at the strace output for the application, you would say it is IOPS driven because of all of the small writes (4KB); however, this might not necessarily be the case because the I/O scheduler and other parts of the OS might take the multiple 4KB write requests and coalesce them into a single write to storage.
What the strace output tells me is that the application is issuing 4KB buffered writes to the OS and I am relying on the OS to convert these into streaming writes to improve performance. The OS doesn't know my application from any other, so it doesn’t know what it can and cannot do; it could be limited in what it can do. Moreover, if a number of applications are running at the same time, it may not be easy for the OS to coalesce writes together from a single application to produce a streaming write, effectively reducing the I/O pattern to one that is driven by IOPS. The application in Listing 2C writes one element at a time with a limiting buffer of 4,096 bytes. In essence, I’ve done a poor job of doing I/O, and I am relying on the OS to save my I/O bacon. Maybe I can try something a bit different to improve performance.
Array of Structures
Rather than rely on the compiler to buffer output into 4KB writes and the rely on the OS to coalesce I/O requests, couldn't I do this myself? The answer is “yes,” and I have several ways to do it. One way is simple – change the I/O portion of the application. In the code below, I changed the single data structure to an array of structures. Then, I fill the array but use a single fwrite() function call after the array is filled to do the writing for me. The resulting code, which I refer to as “array” code, is shown in Listing 3C.
Listing 3C: C Code Example with an Array Approach to I/O
 1  #include
 2
 3  /* Our structure */
 4  struct rec
 5  {
 6     int x,y,z;
 7     float value;
 8  };
 9
10  int main()
11  {
12     int counter;
13     struct rec my_record[7000];
14     int counter_limit;
15     FILE *ptr_myfile;
16
17     counter_limit = 7000;
18
19     ptr_myfile=fopen("test.bin","wb");
20     if (!ptr_myfile)
21     {
22        printf("Unable to open file!");
23        return 1;
24     }
25     for ( counter=0; counter <= counter_limit-1; counter++)
26     {
27        my_record[counter].x = counter + 1;
28        my_record[counter].y = counter + 3;
29        my_record[counter].z = counter + 3;
30        my_record[counter].value = (float) counter * 10.0;
31     }
32     fwrite(&my_record, sizeof(struct rec), counter_limit, ptr_myfile);
33     fclose(ptr_myfile);
34     return 0;
35  }
Using this code, I ran the same four iterations: 100, 256, 500, and 2,000. However, rather than use the term “iterations” for the loop, I will now use “elements” as the size of the array and just change lines 13 and 17 to reflect the number of elements I want. I didn't bother to use an allocatable array for this simple case because I was more interested in the I/O pattern and not necessarily “real” code.
Figure 5C is an excerpt from the 100-element strace output.
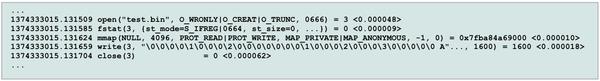 Figure 5C: Strace excerpt with C array code; 100 elements.
Notice that the throughput is about 88.9MBps (1,600 bytes/0.000018 seconds), which is a little bit better than the one-by-one case. However, this application does use more memory because it stores the entire array in memory rather than write the data out one by one. Plus, the OS is doing a lot of caching, so it's difficult to compare the write throughput for the two code modalities.
The excerpt for the 256-element case (C array code) is shown in Figure 6C.
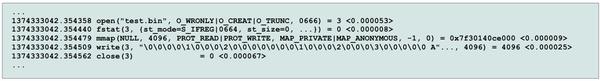 Figure 6C: Strace excerpt with C array code; 256 elements.
The throughput in this case is 163.8MBps (4,096 bytes/0.000025 seconds). So far, the 100- and 256-element cases are really the same as for the one-by-one code, although they are a little faster. Now I want to see whether I can get multiple writes in the 500-element case (Figure 7C).
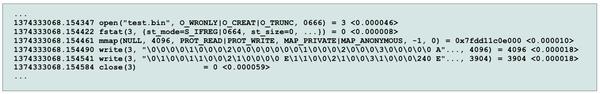 Figure 7C: Strace excerpt with C array code; 500 elements.
Although I now get two write() functions, notice that the first write uses the buffer size limit. I’m not sure why this happens, so I’ll try 2,000 elements and look at the I/O pattern (Figure 8C).
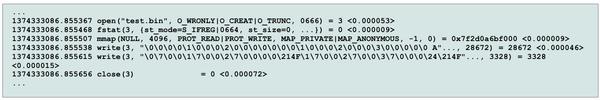 Figure 8C: Strace excerpt with C array code; 2,000 elements.
In the one-by-one example, the 2,000-element case had eight write() functions. Notice in Figure 8C that the array code example has just two writes. The first is 28,672 bytes, and the second is 3,328 bytes, for a total of 32,000 bytes, as expected. The first write() is much larger than the default buffer size, which means I can use larger buffers (that is left as an exercise for the user, but just change lines 13 and 17 in Listing 3C).
Summary
These simple examples illustrate how strace can help you understand the I/O pattern of an application from the application’s perspective. You can get a great deal of useful information from the strace output. Although it doesn't tell you what the OS did with the I/O requests, it does tell you what the application is sending to the OS.
The examples also showed that paying attention to how an application does I/O can be very important. In these C examples, I started at 4,096 bytes per write and managed to achieve much larger sizes, which can improve throughput performance by sequentially streaming an I/O pattern to the OS. This kind of input also helps the OS because it can tell the filesystem to open a file with a large number of allocated blocks, hopefully sequential, to which data can then be streamed to the underlying storage medium, which is the kind of data hard drives really like.
The last thing I wanted to show is that there is more than one way to do I/O. By switching from the "one-by-one" approach, in which I wrote the data once the data structure was full, to the "array" method, in which I created an array of data structures and filled them before writing out the data, I was able to improve my data I/O pattern and write a much larger set of data at once rather than hitting the predefined buffer size. From a theoretical standpoint, the ability to better buffer the data can lead to better throughput performance.
In the next article, I will look at how Fortran 90 handles I/O.