« Previous 1 2 3 Next »
NetFlow reporting with Google Analytics
Traffic Analysis
Reporting NetFlow Entries
Unfortunately, Google Analytics is not familiar with either NetFlow or most of the NetFlow variables (e.g., port number or IP protocol), as opposed to the usual GA categories (e.g., Page views, Events, E-Commerce, Timing). The art therefore lies in correct mapping. The Events section has proven to be very advantageous and flexible in the context of custom dimensions and metrics. These sections offer enough scope to capture all of your NetFlow information.
Conversion from the NetFlow format to the Google Analytics Measurement Protocol [7] and the subsequent production of reports are handled by my flow-ga tool [8], which is called by the NetFlow collector nfcapd at five-minute intervals (Figure 1). After downloading the tool, you should store the files in /usr/bin/. Any additional Perl modules that you need can be installed using the package manager:
$ yum install perl-Time-HiRes \
      perl-Digest-HMAC perl-DateTime \
      perl-libwww-perl
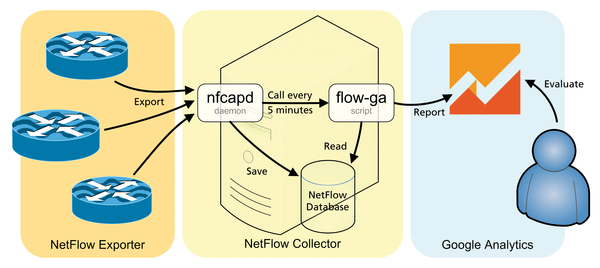 Figure 1: Schematic overview of NetFlow data analysis using Google Analytics.
As usual on Linux, Syslog handles the logging:
$ echo "local5.* /var/log/flow-ga.log" > \
      /etc/rsyslog.conf
$ service rsyslog restart
It is a good idea to take a look at the functions _anonymizeIp() and get_hostname() from flow-ga.pl before starting. You will want to enable anonymization so as not to divulge too many details about the network. Simple anonymization, which inverts the IP address' second octet and makes the host name unrecognizable, is set up by default.
Finally, entering
$ nfcapd -D -w 5 -T all -p 2055 -l /tmp \
             -I any -P /var/run/nfcapd.pid \
             -x "/usr/bin/flow-ga.sh %d/%f"
starts the NetFlow collector as a daemon.
Evaluating Acquired Data
As soon as the first entries arrive in GA, the Real-Time dashboard becomes more colorful and interesting. Collecting IP addresses is useful for a quick top 10 overview. Google only provides the data for professional reports, which provide users with additional insight into its network after 24 hours.
Values in the Behavior/Results fields are available after a few days. Here you can sort by IP addresses, traffic, or access with any time intervals (e.g., last month). In doing so, the event category corresponds to the destination IP address and the event label is the source address. The hostname is run as an event action. The Customization tab offers the deepest insights into the NetFlow data with custom reports (Figure 2). In addition to the NetFlow "top-talkers," you will find unwanted protocols (e.g., Telnet, WINS) or servers.
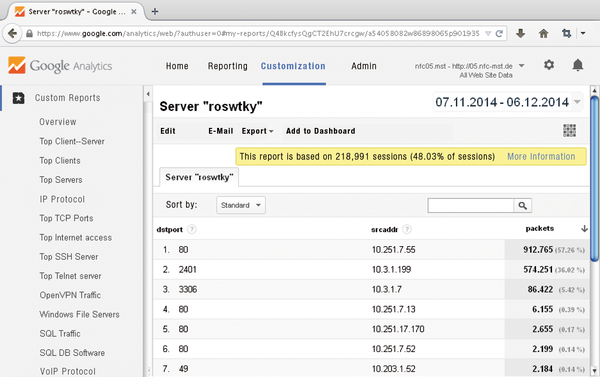 Figure 2: Deep insights into the NetFlow data can be compiled by customizing GA. The example here shows a monitored server.
Limited Opportunities
Unfortunately, not all that glitters is gold because Google sets clear limits for the user. Google Analytics limits the number of samples to 200,000 hits per user per day. That is about 700 samples per five-minute interval. Various potential solutions are possible if more NetFlow samples are actually captured. As well as purchasing your own NetFlow server, you can reduce the volume by taking random samples. My flow-ga.pl tool will help if the router manufacturer does not provide a function for reducing the volume of data. The script only sends every n
th NetFlow entry via the variable $sampling_rate_N. Alternatively, each router uses a separate NFC (near-field communication) daemon to send different GA properties. Of course, in this situation, Google recommends upgrading to the paid service, Google Analytics Premium, which will work without random sampling if desired.
Using random sampling means that the GA data are no longer 100 percent accurate, but the general (trend) analysis or reports for discovering unknown protocols, services, or servers are still possible. Only enterprise-critical applications, such as payroll systems, should keep clear of these data.
Furthermore, many prebuilt GA topics are designed with a view to website optimization and are therefore useless in the NetFlow environment: interests, technology, mobile, demographic characteristics, conversions, AdWords, and campaigns.
All the information sent to GA is ready for evaluation after about 24 hours. Real-time monitoring is only available to a limited extent under the Real-Time tab, and safety-critical monitoring (e.g., denial of service detection) is unavailable.
« Previous 1 2 3 Next »
Buy this article as PDF
(incl. VAT)
Buy ADMIN Magazine
US / Canada
UK / Australia
Related content
-
Improved visibility on the network
 OpenNMS collects and visualizes flows so you can discover which network devices communicate with each other and the volume of data transferred.
 -
DDoS protection in the cloud
 OpenFlow and other software-defined networking controllers can discover and combat DDoS attacks, even from within your own network.
 -
Virtual switching with Open vSwitch
Virtualization with Vmware, KVM, and Xen is here to stay. But up to now, no virtual switch has supported complex scenarios. Open vSwitch supports flows, VLANS, trunking, and port aggregation just like major league switches.
-
Detecting security threats with Apache Spot
 Security vulnerabilities often remain unknown when the data they reveal is buried in the depths of logfiles. Apache Spot uses big data and machine learning technologies to sniff out known and unknown IT security threats.
 -
Run TensorFlow models on edge devices
 TensorFlow Lite on a mobile device predicts harvest time for a real-world vertical farming operation.
Subscribe to our ADMIN Newsletters
Subscribe to our Linux Newsletters
Find Linux and Open Source Jobs
Most Popular
Support Our Work
ADMIN content is made possible with support from readers like you. Please consider contributing when you've found an article to be beneficial.
