Photo by Patrick Schneider on Unsplash

Photo by Patrick Schneider on Unsplash

Kafka: Scaling producers and consumers

Smooth

Article from ADMIN 62/2021
By
A guide to 10x scaling in Kafka with real-world metrics for high throughput, low latency, and cross-geographic data movement.

According to the Kafka home page [1], "Apache Kafka is an open-source distributed event streaming platform … for high-performance data pipelines, streaming analytics, data integration, and mission-critical applications." A basic Kafka ecosystem has three components – producers, brokers, and consumers. Although much has been written about tuning brokers, reliably configuring producers and consumers is something of a dark art. All systems are dependent on your local setup, but some standard metrics that you can look at and knobs that can be tuned can increase performance 10 times or more. In this article, I walk through a real-life(-ish) example of how to diagnose and then fix a bottlenecked stream-processing system.

Assume you are mirroring data from an edge Kafka cluster into a central Kafka cluster that will feed your analytics data warehouse (Figure 1). You've set up the edge with 100+ partitions for many of the topics you are consuming (because you had the forethought to expect scale and knew partitions are generally pretty cheap – go you!). That means you could easily be mirroring 1000+ partitions into your central Kafka for each edge cluster.

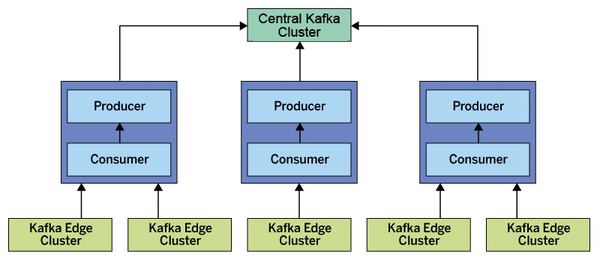
Figure 1: The data generated in the edge clusters travels by mirrors, on which consumers and producers convert the data and feed it into a central Kafka cluster.

In just this small data flow, you would need to consider a number of possible issues. Not only do you need to ensure your Kafka clusters are configured to scale (i.e., the number of partitions, the right tuning parameters) but also that the mirrors are scaled and tuned correctly. Many articles and posts have been written on tuning Kafka clusters, so I will focus on the client side, getting the producer and consumers (conveniently encapsulated in the data mirroring processing) tuned for high throughput, low latency, and cross-geographic data movement.

Edge Kafka clusters have some notable advantages – in particular, geographic fault isolation and reduced latencies to end users: User data can be sent faster to a secure replicated store (i.e., to the central Kafka cluster), which reduces the risk of critical data being lost. At the same time, you get a fallback for any local catastrophes (e.g., an earthquake in California), so your system remains available. However, you still need to get that data back to a central location for global analysis, and that means each of your remote mirrors has an extra 100ms of latency, roughly, for every mirror request you make. Chances are, this isn't going to work out of the box. Too bad, so sad. Time to get engineering!

As you scroll through the logs of your misbehaving consumer, you might see something like the output in Listing 1. If you turn on DEBUG logging, you might also see log lines, as in Listing 2. Your consumer is trying to tell you: I didn't get a response in the time I expected, so I'm giving up and trying again soon.

Listing 1

Misbehaving Consumer

2019-06-28 20:24:43 INFO  [KafkaMirror-7] o.a.k.c.FetchSessionHandler:438 - [Consumer clientId=consumer-1, groupId=jesseyates.kafka.mirror] Error sending fetch request (sessionId=INVALID, epoch=INITIAL) to node 3: org.apache.kafka.common.errors.DisconnectException

Listing 2

DEBUG Logging

2019-06-27 20:43:06 DEBUG [KafkaMirror-11] o.a.k.c.c.i.Fetcher:244 - [Consumer clientId=consumer-1, groupId=jesseyates.kafka.mirror] Fetch READ_UNCOMMITTED at offset 26974 for partition source_topic-7 returned fetch data (error=NONE, highWaterMark=26974, lastStableOffset = -1, logStartOffset = 0, abortedTransactions = null, recordsSizeInBytes=0)

Here are some quick configurations to check:

  • default.api.timeout.ms: In older client versions (pre 2.0) this controlled all the connection timeouts, and increasing it might be all you need to do.
  • session.timeout.ms: The time until your consumer rebalances. Watch the join-rate for all consumers in the group – joining is the first step in rebalancing. High rates here indicate lots of rebalances, so increasing this timeout can help.
  • request.timeout.ms: The time the consumer will wait for a response (as of version 2.0). Logs are a great place to look to see whether you have a lot of failing fetches. Metrics to watch include the broker (kafka.server:type=BrokerTopicMetrics,name=FailedFetchRequestsPerSec) for a gut check of fetch statuses and the client (fetch-latency-avg and fetch-latency-max) for latency when getting data.
  • fetch.max.wait.ms: The time the server will block waiting for data to fill your response. Metrics to watch on the broker are kafka.server:type=BrokerTopicMetrics,name=FailedFetchRequestsPerSec for a gut check of fetch statuses and kafka.server:type=DelayedOperationPurgatory,delayedOperation=Fetch,name=PurgatorySize for the number of fetch requests that are waiting (aka, stuck in purgatory). Metrics to watch on the client are fetch-latency-avg and fetch-latency-max for latency when getting data
  • fetch.min.bytes: The minimum amount of data you want to fill your request. Client requests will wait on the broker up to this many bytes (or fetch.max.wait.ms, whichever comes first) before returning. Metrics to watch on the client, both at the consumer level and the topic level, are fetch-size-avg and fetch-size-max to see your fetch size distribution, records-per-request-avg for the number of messages you are getting per request, and fetch-latency-avg and fetch-latency-max to ensure this configuration is not causing you unexpected latency.

Unless otherwise noted, all the metrics above are assumed to be client (consumer)-side metrics MBeans and have the prefix

kafka.consumer:type=consumer-fetch-manager-metrics,client-id=([-.w]+)

or have topic=([-.w]+)` for topic-scoped metrics.

These configurations can interact in interesting ways. For instance, if you tell the server to wait to fill the request (fetch.max.wait.ms) and have the timeout set short, you will have more retries but potentially better throughput and will have likely saved bandwidth for those high-volume topics/partitions. If you are running clusters in cloud providers, this can save you bandwidth exit costs and, thus, non-trivial amounts of money over time.

Don't forget that whatever you were using when connecting to a geographically "more local" source cluster (i.e., not across the country) will probably stop working if you use the same settings to connect to a more distant cluster, because now you have an extra 50-100ms of roundtrip latency to bear. The default settings with 50ms timeouts for responses mean you will start to disconnect early all the time.

Sadly, I cannot offer any exact advice that will always work for these settings. Instead, along with the associated metrics, these configurations are a good place to start fiddling and can give you a good understanding when reading the standard Kafka documentation.

Now say that you have tuned your timeouts up, made sure you are fetching at least 1 byte, and you are still getting these errors in the logs. It can be a challenge to pinpoint the exact problem; you might have 100+ consumer instances, and because they work as a team, just one bad apple could tip you into perpetual rebalance storms.

To simplify the problem, turn down the number of instances and select only some of the topics you need to mirror. Eventually, you probably will get to a set of topics that suddenly starts to work. Hooray! Things are working magically. Maybe it was those tweaks you made to get the topics working? Time to scale it back up … and it's broken again. Crapola. (This is exactly what happened to me recently.)

Did you remember to check your garbage collection (GC)? I bet you are going to find that your consumers are doing stop-the-world (STW) GC pauses for near or over your timeouts. Your one (or two or three) little mirrors are GCing themselves to death; every time they disconnect, they generate a bunch more objects, which then add GC pressure. Even if your mirror starts working, it can quickly churn garbage and spiral into a GC hole from which it never recovers. This case is even more frustrating because it can look like the mirror is running fine for 10 or 20 minutes, and then suddenly – BOOM! – it stops working.

I've found that using the Java GC command-line options

-server
-XX:+UseParallelGC
-XX:ParallelGCThreads=4

are more than sufficient to keep up. It doesn't use the fancy garbage first GC (G1GC), but for a simple mirror application, you don't need complex garbage collection – most objects are highly transient and the rest are small and very long lived. This setup is quite a nice fit for the "old" Java GC.

Unbalanced Consumers

Consumers can become "unbalanced" and have some instances in the group with many partitions and others with none. But isn't Kafka supposed to distribute partitions across consumers? A quick reading of the documentation would have you think that it should just evenly assign partitions across all the consumers, and it does – as long as you have the same number of partitions for all topics. As recently as Kafka 2.1+ (the latest stable release I've tested), as soon as you stop having the same number of partitions, the topic with the lowest number of partitions is used to determine the buckets, and then those buckets are distributed across nodes.

For example, say you have two topics, one with 10 and another with 100 partitions, and 10 consumer instances. You start getting a lot of data coming into the 100-partition topic, so you turn up the number of consumers to 100, expecting to get 90 consumers with one partition and 10 consumers with two partitions (about as even as you can distribute 110 partitions). That is, one partition on 10 instances for each of topic 1 and then an even distribution of topic 2.

Unfortunately, this distribution is not what you see. Instead, you will end up with 10 consumers, each with 11 partitions and 90 consumers sitting idle. That's the same distribution you had before, but now with extra overhead to manage the idle consumers.

The client configuration you need is:

partitioner.class = org.apache.kafka.clients.producer.RoundRobinPartitioner

Now the consumer group will assign the partitions by round robin across the entire consumer group, which will get you back to the distribution you expected, allowing you to balance load nicely and increase your overall throughput.

Tuning Producers

Now that you have the consumer side of your mirror pushing data quickly, you need to tune up the producing side, as well, to push data to the central Kafka cluster as quickly as possible. Already you are in the 95th percentile of users, because generally the default client configurations are more than enough to work for most producers.

To learn more about the internals of the producers, I recommend you look at a talk by Jiangie Qin [2]. Not only does his presentation walk you through how the producer works, it can give you some first-pass tuning recommendations. Still, I personally prefer a more empirical approach that is based on what clients say in terms of their metrics, which can then be used to optimize your particular use case.

Back to Basics

First, you need to understand why your producer is going slow, so the first question you need to ask is: Is it Kafka or is it me? Maybe it's Kafka. Some metrics to check to ensure that the cluster is happy are:

  • The network handler idle time, kafka.network:type=SocketServer,name=NetworkProcessorAvgIdlePercent which is the idle time for the pool of threads that answer network requests and then pass them onto the request handler pool. I recommend folks to generally not go below 60%, with an average above 80%.
  • The request handler idle time, kafka.server:type=KafkaRequestHandlerPool,name=RequestHandlerAvgIdlePercent which is the idle time for the pool of threads that process the network requests, doing everything from writing data to disk to serving read requests from disk. I recommend folks to generally not go below 60%, with the global average consistently above 70%.
  • Disk utilization. If it's high, the cluster likely is maxed out and cannot write/read any more data.
  • CPU usage should not be high if the above metrics are happy, unless you are running other processes on the server. Kafka uses a lot of thread pools, so that is likely to cause CPU contention and slow down the broker. Generally, try to avoid co-locating processes (especially processes with high CPU use) with brokers.

Unfortunately, in this convenient tuning investigation story, Kafka seems to be idling happily along, so you are left with tuning your client.

The obvious first starting place is ensuring that you have compression.type set on your producer. Compression on the producer side is seriously worth considering, especially if you have even a little bit of extra CPU available. Producer-side compression will help Kafka store more data quickly because the broker just writes the data to disk directly out of the socket (and vice versa for the consumer path), making it much more efficient for the whole pipeline (writing, storing, and reading) if the producer can just handle the compression up front.

If you are running Kafka 2.X+, you should have access to zstd compression. Some tests I've seen show a marked improvement over the alternatives. It got close to gzip compression, but with the CPU overhead of lz4. Other tests I've run on my data show it can be significantly worse than other, already quite compressed formats. Your mileage may vary; be sure to test on your data.

The next thing you should check is the state of your batches. The easiest configuration to tweak is linger.ms. You can think of this as batching by time. By increasing latency, you can then increase your throughput by eliminating the overhead of extra network calls.

Therefore, you should check out the record-queue-time-avg metrics, or the average time a batch waits in the send buffer (aka, how long it takes to fill a batch). If you are consistently below your linger.ms, you are filling your batch sizes. The first tweak is to increase latency so that you can (no surprise) increase the throughput, too, by increasing linger.ms (Note that Kafka defaults to not waiting for batches, leaning toward producing lower latency at the risk of more remote procedure calls). I find 5ms is a nice sweet spot.

The configurations used so far are then

compression.type=zstd
linger.ms = 5

Unfortunately in this convenient example, even after setting compression and tuning linger.ms, you are still not getting the throughput you need.

Buy this article as PDF

Express-Checkout as PDF
Price $2.95
(incl. VAT)

Buy ADMIN Magazine

SINGLE ISSUES
 
SUBSCRIPTIONS
 
TABLET & SMARTPHONE APPS
Get it on Google Play

US / Canada

Get it on Google Play

UK / Australia

Related content

comments powered by Disqus
Subscribe to our ADMIN Newsletters
Subscribe to our Linux Newsletters
Find Linux and Open Source Jobs


Support Our Work

ADMIN content is made possible with support from readers like you. Please consider contributing when you've found an article to be beneficial.

Learn More”>
	</a>

<hr>		    
			</div>
		    		</div>

		<div class=