« Previous 1 2
New Monitoring Tools
Bottom
The graphical process and system monitor Bottom is in the same vein as Zenith and Bpytop and is inspired by gtop, and gotop, which are derived from vtop. Bottom can create great ASCII plots of CPU usage; memory usage, including RAM and swap usage; and network usage for send and receive data. The tool can also provide information about disk capacity, I/O operations per second (IOPS), and sensor information – primarily temperatures.
A good process management section gives you some insight into the resources used by each process. Of course, it can be used to kill processes, if needed. An additional feature that can be overlooked is that Bottom is cross-platform: It can run on Linux, macOS, and Windows. Not many of the previous generation of Top-like tools can do this.
After installation, just run Bottom with the btm command. I have lm_sensors installed on my test system, and I had run some code just before issuing the command, so when it started, Bottom looked like Figure 9.
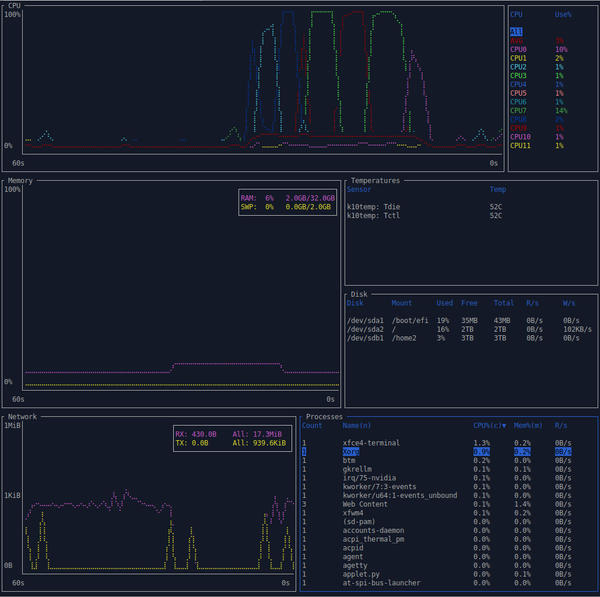 Figure 9: Bottom initial screen.
The screen is broken into “widgets.” The top left widget is a CPU usage chart. To the right of that is a table listing the CPU usage. The widgets in the next row down, left to right, are a chart of memory usage, then a table of sensor values, with a table of mounted filesystems below that. The bottom row of widgets is, left to right, a network usage chart and a process table. To move between widgets, click on a window or use the Ctrl+<arrow key> combination. The selected widget will have a blue border.
In Figure 10, I ran OpenMP code that used all of the processors, which you can see in the CPU usage table. Notice that CPU listings are all at 100%. The red curve, according to the CPU table, is the AVG (average) of all of the cores.
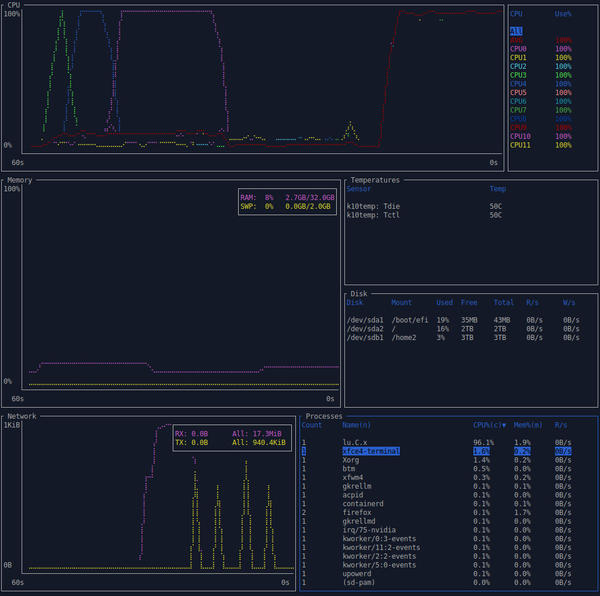 Figure 10: Screenshot of Bottom when running OpenMP code and using all the cores.
Details of the command-line arguments when invoking Bottom are on the GitHub page. Bottomalso has a very comprehensive set of options for managing processes, including searchers, which also can be found on the GitHub page.
I have not explored Bottom too much. However, I really do like its ASCII plot capability. You can zoom into, or expand, the widget by pressing e when a widget is selected. Figure 11 shows an example of expanding the CPU usage chart.
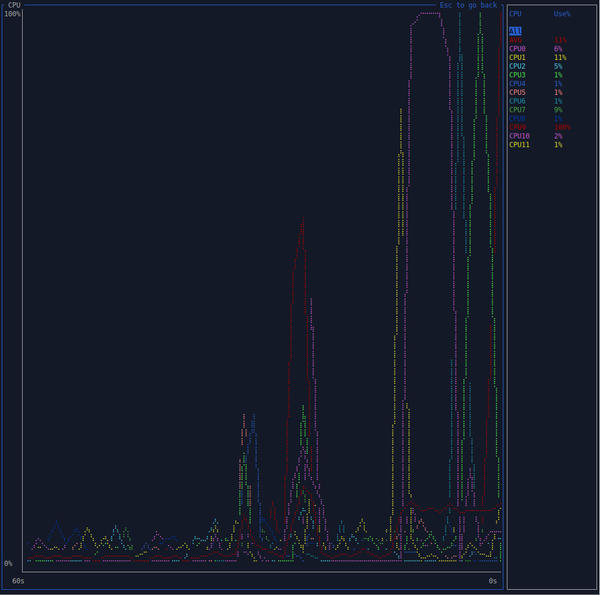 Figure 12: Screenshot of Bottom with expanded view of CPU usage when running OpenMP code.
Summary
I have always found ASCII-based monitoring tools to be of extreme value, even when not administering a huge cluster. I am always on the lookout for new ASCII tools. In this article, I looked at three new tools, all of which are worthy of inclusion in your list of go-to tools when the chips are down.
« Previous 1 2