
If you like ASCII-based monitoring tools, take a look at three new tools – Zenith, Bpytop, and Bottom.
New Monitoring Tools
A long time ago, I was a system administrator for a couple of HPC systems, but I also inherited two HP (Hewlett-Packard) N-class servers (mainframes). Along with two WORM storage units, these were the main servers for the core engineering group. They were busy systems, and I had to work hard to keep up with administration, backups, and software patches.
When a CPU failed in one of the servers, and HP discovered that the previous admin had configured them in high availability (HA) mode, even though they were not licensed for HA, I had to “uncouple” the servers. During the process, I lost access to them. For a new admin, this was a bit unnerving, but with the help of some more experienced admins, the servers soon were back up.
During this time, I only had terminal access (ASCII) to the servers, so I used ASCII monitoring tools to help debug the problems. The combination of the stress of getting the servers back in a usable state as quickly as possible and the invaluable help from the ASCII tools indelibly put ASCII monitoring tools on my list of go-to tools and tricks.
I admit I am a sucker for new monitoring tools. Although I’m comfortable with the ones I use, I do enjoy seeing new ones and trying them out. Because of the history I just disclosed, this is particularly true for ASCII-based tools. Recently, I have learned about some new tools that look interesting.
Zenith
Zenith, a new monitoring tool to me, monitors and presents ASCII charts of an extensive list of metrics. You can even zoom in on these charts, which is something I have not seen before, and manipulate processes, including changing the priority or sending signals to them. An example of the available metrics includes:
- CPU, memory, network, and disk usage charts
- Top users of CPU, memory, and disk
- A process filter table (kind of like Top)
- Nvidia GPU utilization metrics
- Summary of free disk space, NIC IP address, and CPU frequency
- Great battery information for laptops
By default, Zenith comes with a multisection interface (Figure 1).
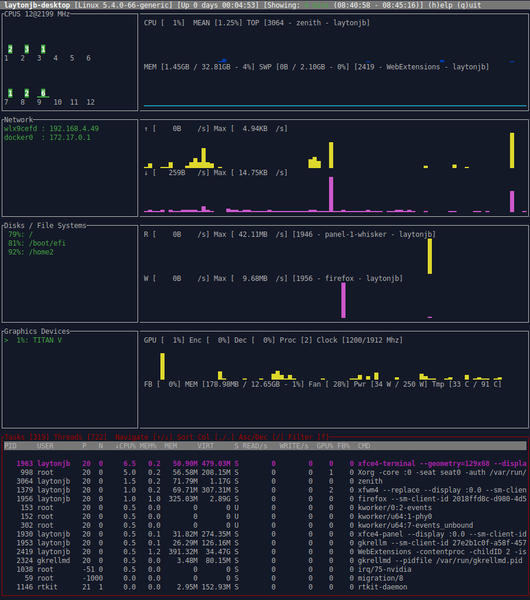 Figure 1: Zenith interface on startup.
At the very top is a quick summary line showing the system name, the kernel version, length of time the system has been up, and length of time it has been taking data, including the time interval for which data exists.
Below the top line, Figure 1 shows five sections for my system. From top to bottom is the chart of CPU performance, the network performance chart, disk/filesystem performance, a graphics chart (for my Nvidia GPU), and the task interface at the bottom. To skip between the sections, just press the Tab key. The current section is outlined in red (the task interface in this example).
Within each chart you also get text information about the status above and below the chart. For example, in the CPU chart at the top, you can see CPU time information, as you would see in Top, as well as the top user and application (in this case, user laytonjb and the zenith application). You also see the memory usage, swap usage, and number one user of memory (user laytonjb and the WebExtensions application).
To zoom in to a section, just press the e key to “expand” (Figure 2). If you want to reduce the zoom, use the m key to “minimize” (Figure 3). Think of it as zooming in and out in your web browser. If you like, you can zoom in on all the charts with the plus (+) key. Likewise, you can zoom out all with the dash (-) key.
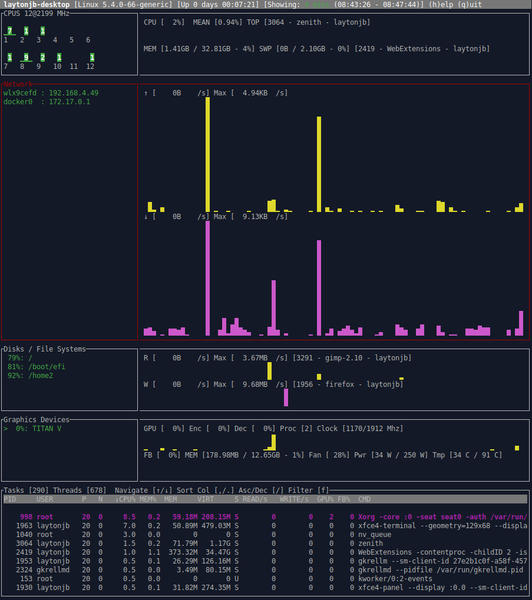 Figure 2: Expanded interface of the Zenith network chart.
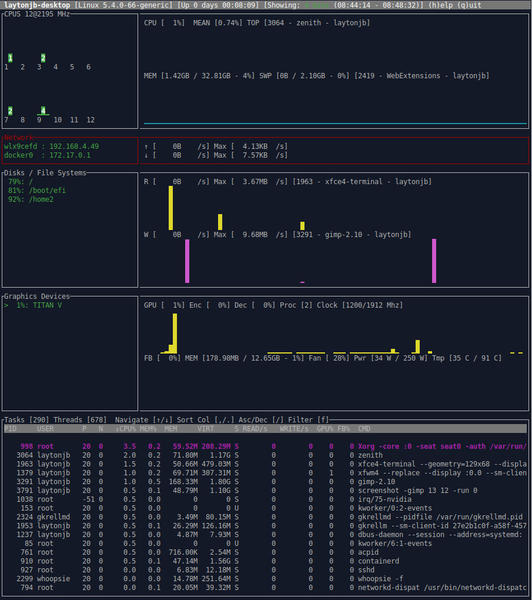 Figure 3: Minimized interface of the Zenith network chart.
The charting capability is particularly impressive. Expanding (zoom in) or minimizing (zoom out) is very simply. One of my favorite features is scrolling back in time (Figure 4).
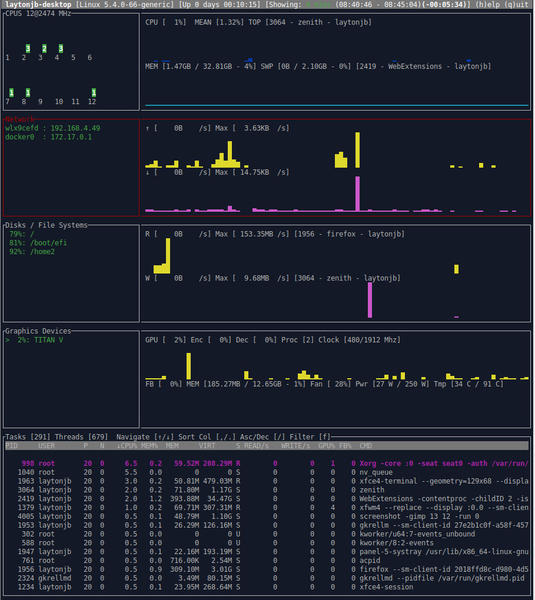 Figure 4: Going back in time with Zenith.
You can tell the chart has gone back in time because at the very top it says (-00:05:34), or 5 minutes, 34 seconds in the past. The advantage of scrolling back in time is the ability to save system performance data. By default, Zenith records data at two-second intervals.
I have been looking for an ASCII-based monitoring tool that is capable of monitoring CPU and the Nvidia GPU for some time. I had thoughtBashtopmight do that, but the author wanted something generic for all GPUs, which doesn’t exist. Now Zenith has delivered. In the previous four figures you can see the GPU performance chart (fourth from the top) with a summary of the statistics just below.
Bpytop
Previously, I wrote a quick introduction to Bashtop. This particularly good monitoring tool has some great capabilities, including real-time ASCII plots. Remarkably, the tool is written entirely in Bash scripting.
At the time of that article, the author of the tool thought about switching to Python to make coding easier and to add capability. Bpytop, the Python port of Bashtop, is the result (Figure 5).
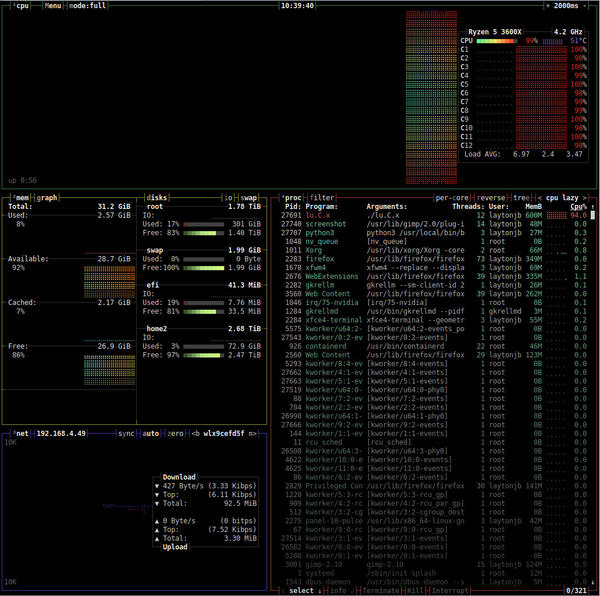 Figure 5: Bpytop initial screen.
When I took the screenshot you see, I was running an OpenMP application that used all the cores – six real cores and six hyperthreading (HT) cores. The CPU chart at the top is at peak for all the cores. You can also see the CPU load at top right with the load for each core.
Overall, the interface is remarkably close to that of Bashtop. One exception is the storage information on the left-hand side, just below the CPU chart. Bpytophas both memory usage and usage per disk.
To highlight the top process in the process window at bottom right, press the Enter key; you will see a screen like that shown in Figure 6. Notice that a small window opens just above the process table listing CPU usage, memory usage, the user, and more about that process.
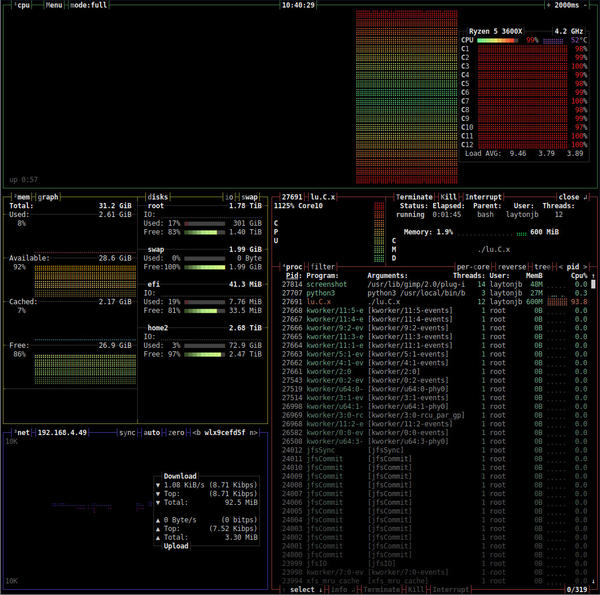 Figure 6: Bpytop process information.
To toggle the various sections on and off, press 1. The first press turns off the CPU “box” (the information), and pressing it again makes the CPU box reappear. A 2 keypress turns memory box on and off, a 3 keypress turns the network box on and off, and a 4 keypress turns the process box on and off.
Moreover, you can use the keys in combination. For example, from the starting interface, you can press the 1-2-3 keys simultaneously and end up with only the process box. If you press the 2-3 key combination, you end up with the CPU box and the process box (Figure 7). If you turn off the disk box, leaving only the CPU, network, and process boxes, the interface looks like Figure 8.
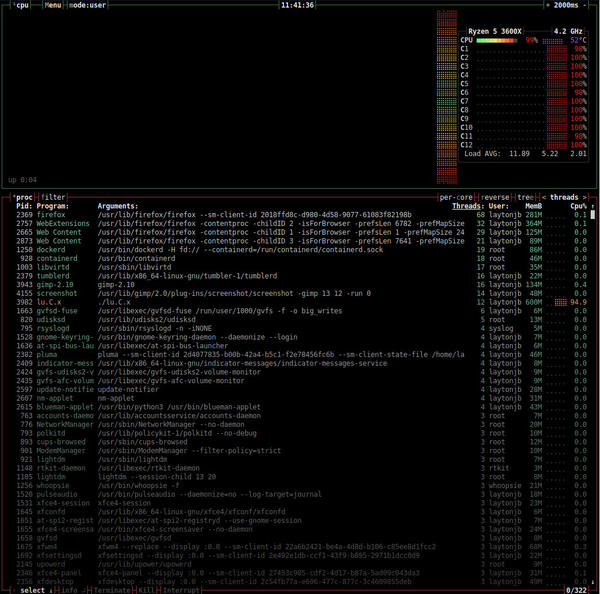 Figure 7: Bpytop CPU and process boxes.
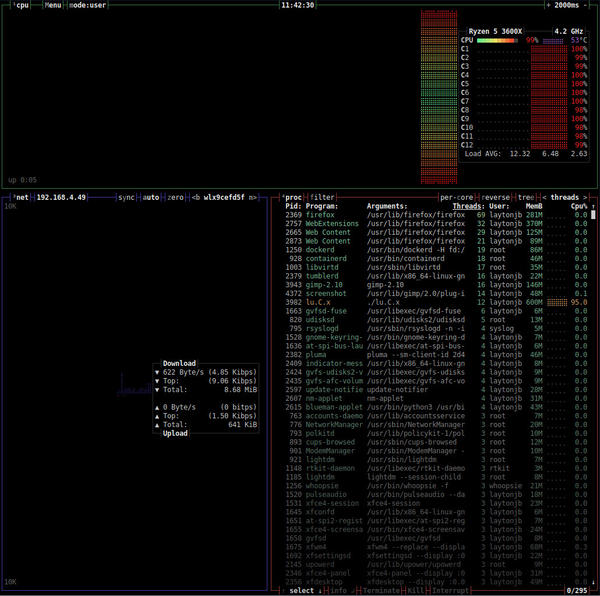 Figure 8: Bpytop CPU, network, and process boxes.