Fishing with Remora
Timing techniques and system-level monitoring tools like Remora provide insight into application behavior and how applications interact with system resources.
In a previous article, I discussed ways to supporting HPC users, especially through effective monitoring. Without a clear understanding of what your application is doing, improving performance becomes extremely challenging. Optimization can feel like a “ready, fire, aim” process driven mostly by experience or scattered advice. Fortunately, there are systematic ways to begin this journey. As the King said in Alice's Adventures in Wonderland, “Begin at the beginning.”
Timers
One of the simplest and most effective ways to understand how your code behaves is through timers – functions that return either the current time or the elapsed time since it was last called. This approach works well for serial applications, including those accelerated with GPUs, because it allows you to measure execution time for specific regions of code and determine whether changes you make result in actual improvements.
Parallel applications introduce more complexity. Measuring total runtime doesn’t reveal how individual functions behave internally. However, if your application is structured with a serial main routine that executes several ordered steps, each containing a parallel region, you can measure the time required for all parallel processes to complete each step, which yields more detailed insights into performance within the larger application workflow. The pseudocode in Listing 1 is not parallel, but it has parallel processes to complete tasks within a serial framework.
Listing 1: Structured Main Routine
Step 1:
|-> Run in parallel

Step 1 Parallel portion completes. Do some single thread computations.

Step 2:
|-> Run in parallel

Step 2 Parallel portion complete. Do some single thread computations.

...
With this type of code, you can collect elapsed times after all parallel processes complete a specific step. This arrangement works like an MPI barrier function (MPI_Barrier). Although collecting these timings gives you useful information, they won’t reveal which parallel process finishes last and therefore controls the overall pace. If the slowest running process remains unchanged, improvements to other processes may be difficult to detect. You can add per-process timers to gather more detailed statistics, but in applications with a small number of processes, the resulting data might be limited. Still, timers are an excellent starting point for learning how your application consumes time and system resources.
You can instrument each parallel process with timers to compute per-process elapsed times and examine basic statistics. However, if the number of parallel processes is small, the statistics might not be very insightful. Even so, timers are a solid starting point for understanding how your application consumes system resources.
Teaching Users How to Fish
Users typically have limited access to system-level information, but they still have many tools available for monitoring their own jobs. For example, repeatedly running the uptime command during execution can reveal overall CPU load trends. A simple script can capture these outputs, allowing you to plot 1-, 5-, and 15-minute load averages and observe how your application uses system resources.
Additional command-line utilities from the system suite can gather information such as I/O usage, memory activity, network traffic, NFS performance, and general system metrics. Other tools offer detailed insight into data movement, socket statistics, swapping, and filesystem behavior. Although orchestrating these tools and analyzing the results requires effort, the information they provide can be invaluable.
Remora is a tool that simplifies this process by coordinating several Linux system utilities while also gathering data from /proc and /sys. It produces clean, readable summaries and charts of application-level resource usage without requiring users to modify their applications.
Remora Top-Level View
My previous writings about Remora revealed how it acts as a “tool of tools,” combining several Linux utilities with system data to produce a cohesive overview of resource usage. Although users can gather this information manually, coordinating these tools is difficult. Remora streamlines the process and provides insightful charts summarizing application behavior. In the next section, I introduce a simple application that demonstrates Remora’s capabilities.
2D Laplace Solver
For this demonstration, a simple two-dimensional (2D) Laplace solver is provided in several versions. The first uses a single CPU thread. The second employs OpenACC to use the system GPU. The third divides the computational domain into a 2D grid processed by separate cores, with MPI handling communication.
The test system runs Ubuntu 24.04 with the NVIDIA HPC SDK (version 25.7) and includes a 32-core CPU with hyperthreading and a single NVIDIA RTX 5000 GPU. No process or thread binding was applied, which becomes evident in the results.
For CPU-only runs, the following Remora modules were enabled:
- cpu,CPU
- memory,MEMORY
- numa,NUMA
- eth,NETWORK
When running on the GPU, the GPU module was added:
- gpu,GPU
In addition to defining the module, an environment variable is defined
$ export REMORA_CUDA=1
that tells Remora that the GPU module should be used.
Single Thread – CPU
A simple 2D Laplace solver was compiled and executed. Remora produced a quick summary of what Remora detected on the system (Listing 2).
Listing 2: 2D Laplace Solver Output
=============================== REMORA SUMMARY ===============================
 Max Virtual  Memory Per Node :    73.89 GB
 Max Physical Memory Per Node :     3.25 GB
 Available Memory at time 0.0 :    59.36 GB
 *** REMORA: WARNING - Couldn't find the GPU memory summary file
 Total Elapsed Time           :  0d 0h  3m 15s 650ms
==============================================================================
 Sampling Period              : 1 seconds
 Report Directory             : R=/home/laytonjb/TEMP/remora_XXXXXXXXXX
 Google Plots HTML Index Page : $R/remora_summary.html
==============================================================================
Running the single-threaded version of the solver produces a Remora summary with basic system information: memory usage, total execution time, and the location of the generated HTML report. By opening the generated remora_summary.html file, users can review charts such as CPU utilization over time. Screenshots of this page have been shown in other articles, so I don’t need to reproduce that work here. Rather, I'll present some of the interesting charts that Remora produces to explain how a user might interpret the results.
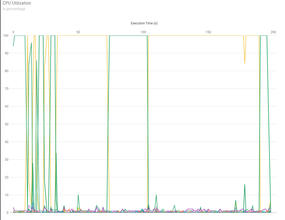
Before I ran the code, I modified the environment variable to change the resolution of data gathering from every 10 seconds to every 1 second, which results in a great deal more data that however helps with interpreting the results. The first chart is CPU utilization (Figure 1).
One notable behavior in this chart is process migration across CPU cores. Because the application uses only one thread, ideally it would remain on a single core. However, unless instructed otherwise, the Linux kernel scheduler can move processes from core to core. These migrations can introduce unnecessary overhead; Remora’s visualization helps users identify this behavior.
Remora also generates charts for memory, non-uniform memory access (NUMA) locality, and network activity. In this example, these metrics do not reveal meaningful trends and are not discussed further.
OpenACC – One GPU
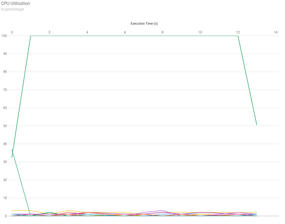
A GPU-accelerated OpenACC version of the solver was also tested. Compiled with the NVIDIA HPC SDK, this version runs dramatically faster than the single-thread CPU implementation. The Remora CPU utilization chart shows a single CPU thread consistently at 100%, without the frequent core switching observed previously.
Performance improved dramatically: The single-core CPU version required more than 192 seconds, whereas the OpenACC version completed in roughly 13 seconds – a speedup of nearly 15 times. A more complete comparison would include multicore CPU runs, although these are omitted here for brevity.
The subsequent code was compiled with the NVIDIA HPC SDK compilers, version 25.7; look at the CPU utilization chart first (Figure 2). Notice in the chart that only a single process reaches 100% utilization. The kernel scheduler does not move it to a different core during the run because the color is green, and you don’t see large CPU utilization of any other color.
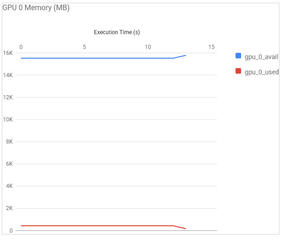
The next chart of interest, GPU utilization, is shown in Figure 3. The chart shows modest GPU load because the problem size is relatively small. Nonetheless, Remora successfully captures GPU resource usage and can help users understand how effectively their applications make use of GPU hardware.
As in the previous case, the NUMA information, the memory utilization information, and the Ethernet utilization charts are not included because they don't provide useful information for this code.
MPI
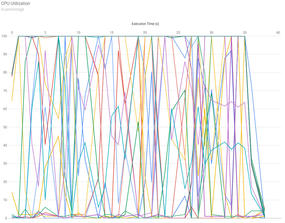
The MPI version of the Laplace solver requires additional work because of communication patterns and boundary exchange across the 2D grid. This version was run on 24 CPU cores. CPU utilization is shown in Figure 4. The chart for this case is particularly interesting, in that it reveals extensive process movement among cores, which can introduce measurable overhead. Understanding this kind of behavior is valuable for users who want to optimize MPI performance.
Summary
In this article, I demonstrated how HPC users can benefit from simple timing techniques and system-level monitoring tools. Whereas timers provide foundational insight into application behavior, tools like Remora give users a deeper understanding of how their applications interact with system resources – without requiring code modifications. By learning to gather and interpret this data, users become more self-sufficient and better equipped to improve the performance of their applications. Teaching HPC users how to observe and reason about performance is ultimately more valuable than simply tuning their applications for them.


