Lead Image © Maxim Kazmin, 123RF.com

Lead Image © Maxim Kazmin, 123RF.com

Visualizing time series data

Painting by Numbers

Article from ADMIN 22/2014
By
Graphite converts confusing columns of time series data into handy diagrams, showing trends in operating system and application metrics at a glance.

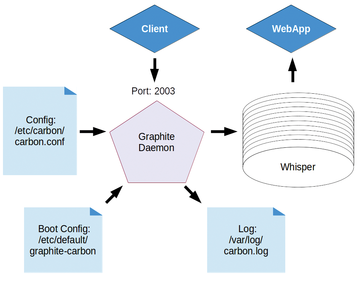
Graphite [1] is hierarchically structured, real-time graphing system (Figure 1). A client collects data from the source, and a Graphite daemon (Carbon [2]) on TCP port 2003 receives the data and stores it in a round-robin database named Whisper.

Figure 1: Graphite is hierarchically structured; various components must play together.

A web application then grabs the data from this database and creates charts. The client can be programmed by the user or it can come as a prepared daemon (e.g., collectd [3]). If you like to measure your own applications, you can send performance data to a client like statsd [4].

Installation

The easiest way to install Graphite is from the package repository of your distribution. Graphite is available in some of the latest distributions, like Fedora 20 or Ubuntu 14.04 LTS. You can also find ready-made images for a virtualization solution like Docker. A simple docker graphite search shows a number of Graphite images.

Of course, you can also install Graphite from the Git sources [5]. In this case, however, you must consider that not all versions of the needed libraries will work well together, whereas the package maintainers have taken over the task of sorting this out for you.

All packages come with prepared config files. They contain reasonable defaults, so you won't have much to edit. Fedora has the necessary init files, but they are not activated to start automatically on a certain run level.

Example Client

The Git sources contain an example client written in Python that is missing in the Ubuntu package. However, this is not the end of world, because it is fairly easy to write a client in a language of your choice: I used Perl for an example in this article (Listing 1). The only thing the client has to do is send a text string in the format

Listing 1

Perl Example Client

01 #!/usr/bin/perl
02
03 use strict;
04 use warnings;
05 use IO::Socket;
06 use Sys::CpuLoad;
07
08 my $remote_host = '192.168.56.102';
09 my $remote_port = 2003;
10
11 # create Socket
12 my $socket = IO::Socket::INET -> new(PeerAddr => $remote_host,
13     PeerPort => $remote_port,
14     Proto => "tcp",
15     Type => SOCK_STREAM)
16     or die "Couldn't connect to $remote_host:$remote_port: $@ \n";
17
18
19 while() {
20  my @lavg = Sys::CpuLoad::load();
21  my $ts=time();
22  print $socket "system.loadavg_1min $lavg[0] $ts\n";
23  print $socket "system.loadavg_5min $lavg[1] $ts\n";
24  print $socket "system.loadavg_15min $lavg[2] $ts\n";
25  sleep(60);
26 }
27
28 close($socket);
<metric_name> <metric_value> <metric_timestamp>

to port 2003 on the Graphite server. The time stamp is an integer value in Unix time (i.e., POSIX time or Epoch time), which is the number of seconds since 00:00:00 Thursday January 1, 1970, Coordinated Universal Time (UTC).

The example client in Listing 1 sends the load average values of the last 1, 5, and 15 minutes (lines 22-24), which you can find in the web GUI under the system node. Dots in the name create folders in the hierarchy; to create a graph, you then just click on one of the values in the web app.

Collectd

An alternative to a self-written client is collectd. This daemon, which is available in most distros from their package management system, can delivery a variety of performance data to Graphite.

The collectd configuration file, /etc/collectd/collectd.conf, will need some changes. You have to remove the comment characters before the write_graphite plugin entry, adapt the Host line, and set the protocol to tcp.

The rrdtool plugin isn't necessary anymore and should be commented out. Furthermore, you should set AutoLoadPlugin to true. Next, activate the desired plugins listed in the config file; then, restart the daemon with

/etc/init.d/ collectd restart

to send the values of the activated collectd plugins to Graphite. If the daemon is receiving values, you should see a line like

14/07/2014 12:38.21 :: MetricLineReceiver connection with \
  192.168.56.1:52981 established

in the logfile /var/log/carbon/listener.log. If not, an error message may point you to a malformed line. If you have a problem with the connection, you can look in the syslog of the collectd host. If all went well, a collectd entry appears in the tree view of the Graphite host with all the values for the activated collectd plugins (Figure 2):

Figure 2: Graphite tree view detail of the collectd data sources.

Buy this article as PDF

Express-Checkout as PDF
Price $2.95
(incl. VAT)

Buy ADMIN Magazine

SINGLE ISSUES
 
SUBSCRIPTIONS
 
TABLET & SMARTPHONE APPS
Get it on Google Play

US / Canada

Get it on Google Play

UK / Australia

Related content

  • Graphite: Collect and Visualize Numeric Data

    Graphite converts confusing columns of time series data into handy diagrams, showing trends in operating system and application metrics at a glance.

  • Proactive Monitoring
    System administrators usually take action after monitoring software indicates the failure of a service or server. In contrast to this reactive approach, a proactive monitoring solution with Riemann allows admins to detect problems in advance.
  • Monitoring with collectd 4.3
    Collectd 4.3 is a comprehensive monitoring tool with a removable plugin architecture.
comments powered by Disqus
Subscribe to our ADMIN Newsletters
Subscribe to our Linux Newsletters
Find Linux and Open Source Jobs


Support Our Work

ADMIN content is made possible with support from readers like you. Please consider contributing when you've found an article to be beneficial.

Learn More”>
	</a>

<hr>		    
			</div>
		    		</div>

		<div class=