« Previous 1 2 3 Next »
Visualizing data captured by nmon
In Good Time
Real-World Scenario
A recent project at my company involved a fine-grained load test with the objective of monitoring performance in a rather short time epoch. To begin, I collect nmon data by entering the familiar command line,
./nmon -f -t -s 2 -c 1800
with a logging interval of two seconds, while using the nmon interactive mode to monitor the system. During the load test, I noticed an unexpected performance degradation (and CPU utilization spike; Figure 8). Nothing out of the ordinary really showed up because the time granularity was just too short to catch the anomaly.
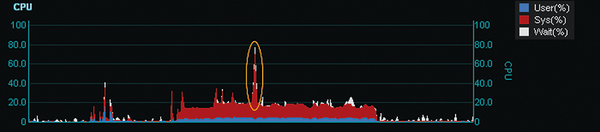 Figure 8: Load test result.
A first hunch might be that the load program itself encountered a glitch or the system had a problem. Either way, I needed to identify the source of the problem and describe the reason for the anomaly.
Luckily, data visualization is an ONA Plus strength. In the Chartlist Detailed
view for the respective server (for the test period), I was immediately able to visualize the situation. The excerpted process chart (Figure 9) shows that at the time of the CPU spike, the CPU resource was being consumed by a dd task that had nothing to do with the load test program per se.
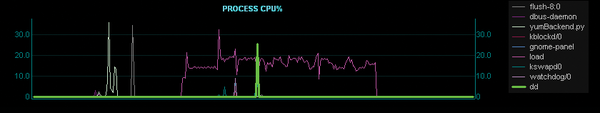 Figure 9: Charlist Detailed view for a server with a performance anomaly.
Once I understood the source of the anomaly, I was able to restart the load test program (omitting the dd task) to see the expected processing behavior. This process further assured the repeatability and reliability of the load test without having to conduct a more extended troubleshooting analysis. These drill-down features, available within a single analysis ecosystem, are indispensable. (Later, the person who executed the dd was scolded a bit.)
Speed and Time to Answer
After continuing the load test for another six hours, I wound up with approximately 250MB of nmon logfiles. Those who use the nmon Analyser Excel spreadsheet [3] know that you cannot process logs of that size without first having to do some customization. However, ONA Plus ingested the 250MB of nmon files without a problem and had the results ready for analysis in less than 10 seconds. A couple of mouse clicks then specify any time period of interest.
Although I might have been able to accomplish the same results with the Excel nmon Analyser or the Python- or Java-based nmon analyzers [4] [5], which I also used before employing ONA Plus, analyzing vast amounts of data with these tools required a lot of preprocessing activities that were very labor intensive. More importantly, I could not obtain and provide the results needed within a reasonable time frame. In a lot of performance evaluation projects, time to answer is paramount!
Reporting
Another ONA Plus feature I like is the ability to create documents that report performance behaviors over a period of time (in this case, around 10 days). The above-mentioned load test was conducted to characterize a replacement scenario for an existing (older) system that had daily nmon monitoring and logging turned on. Once ONA Plus ingested the daily nmon files for the server being tested, the data was stored in the database, from which the results could be viewed and reviewed, regardless of the merging process of the logfile. Not only did I get a clear picture (Figure 10) of the results over the 10-day stretch, I could also easily move the results into Excel or any other reporting tool.
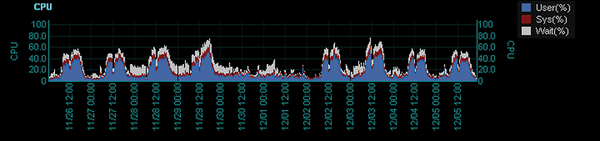 Figure 10: A 10-day visualization of load test results.
The capabilities discussed here are not limited to one server but expand to every server at any point on the timeline. In this article, I do not show the tool's ability to analyze nmon logs for a group or a number of servers, but daily, I use the tool to analyze high-performance computing systems with hundreds and thousands of Linux nodes. Considering that the simple load test generated a 250MB nmon logfile in approximately six hours, it is apparent that a tool such as ONA Plus is indispensable if you are using nmon to collect data on many server systems in your IT infrastructure.
« Previous 1 2 3 Next »
Buy this article as PDF
(incl. VAT)
Buy ADMIN Magazine
US / Canada
UK / Australia
Related content
-
Nmon: All-Purpose Admin Tool

HPC administrators sometimes assume that if all nodes are functioning, the system is fine. However, the most common issue users have is poor or unexpected application performance. In this case, you need a simple tool to help you understand what’s happening on the nodes.
-
GUI or Text-Based Interface?

Sys admins are like smokejumpers who parachute into fires, fighting them until they are out, or at least under control. When you jump into the fire, you only have the tools you brought with you.
Subscribe to our ADMIN Newsletters
Subscribe to our Linux Newsletters
Find Linux and Open Source Jobs
Most Popular
Support Our Work
ADMIN content is made possible with support from readers like you. Please consider contributing when you've found an article to be beneficial.
