« Previous 1 2 3
Visualizing data captured by nmon
In Good Time
Setting up ONA Plus
ONA Plus is available by subscription from onTune [6], or you can download a 30-day free trial [7] to try before you buy. A license for one Windows computer for one year includes all updates and releases, with remote support (email, fax, phone), available eight hours a day (US eastern time). The published price is $2,000 per year, but at the time of publication, onTune was having a limited-time offer of $1,500 per subscription.
Once you have the software, setting up ONA Plus on your Windows laptop or PC is pretty straightforward. The tool comes with an easy install script that basically does everything for you. The easiest way to proceed is just to run the install tool (Figure 11), which performs all the necessary configurations and sets up the MariaDB database that is included with the download package. The install package is easy to use, and most of the installation files are just MariaDB files plus a few files for the tool itself. (See also the "Improvements" box.)
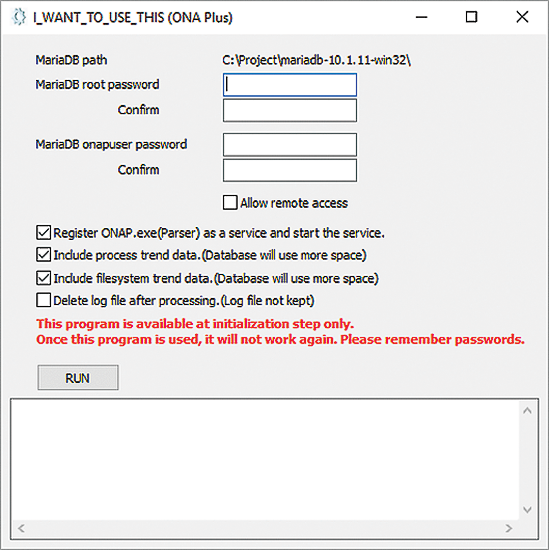 Figure 11: The ONA Plus installation tool. As always, please remember your MariaDB password.
Improvements
The following items for improvement of ONA Plus are on my wish list:
- A Linux version – Although the tool runs reliably and quickly on Windows laptop systems, unfortunately, a Linux version is currently not in the developer's plan. It would be nice to see this development, because my company is a Linux shop and hence does not really have any Windows-based systems.
- Continuous processing of nmon logs as they become available – After the initial copying and processing of nmon logs, it would be really cool if any subsequent logs would be ingested and processed automatically as they are made available and the corresponding results incorporated into the overall charts and body of information.
- Color schemes and chart and graph backgrounds – Because this tool visualizes data, it would be beneficial to be able to change the background color. In data center environments, especially, the light tends to be either rather dim or very bright, and the dark background can make it difficult to view the performance graphs.
Summary
Visualizing nmon data in an efficient and effective fashion requires a tool that is fast, reliable, scalable, and easy to use. I have had very good experiences with ONA Plus analyzing very large logfiles from hundreds of server systems. The tool is speedy and true to the data, with a straightforward interface, and it comes with sufficient bells and whistles to guarantee a good user experience while providing accurate, valuable results.
Infos
- Monitoring with nmon: http://www.admin-magazine.com/HPC/Articles/Nmon-All-Purpose-Admin-Tool/(language)/eng-US
- ONA Plus: http://ontune.us/ona-plus/
- Excel Nmon Analyser: https://www.ibm.com/developerworks/community/wikis/home?lang=en#!/wiki/Power+Systems/page/nmon_analyser
- pyNmonAnalyzer: https://github.com/madmaze/pyNmonAnalyzer
- Java Nmon Analyser: https://sourceforge.net/projects/jnmonanalyser/
- Subscription: http://ontune.us/buy-now/
- Free trial: http://ontune.us/freetrial/
« Previous 1 2 3
Buy this article as PDF
(incl. VAT)
Buy ADMIN Magazine
US / Canada
UK / Australia
Related content
-
Nmon: All-Purpose Admin Tool

HPC administrators sometimes assume that if all nodes are functioning, the system is fine. However, the most common issue users have is poor or unexpected application performance. In this case, you need a simple tool to help you understand what’s happening on the nodes.
-
GUI or Text-Based Interface?

Sys admins are like smokejumpers who parachute into fires, fighting them until they are out, or at least under control. When you jump into the fire, you only have the tools you brought with you.
Subscribe to our ADMIN Newsletters
Subscribe to our Linux Newsletters
Find Linux and Open Source Jobs
Most Popular
Support Our Work
ADMIN content is made possible with support from readers like you. Please consider contributing when you've found an article to be beneficial.
