Lead Image © Lucy Baldwin, 123RF.com

Lead Image © Lucy Baldwin, 123RF.com

Measuring the performance of code

Punching the Clock

Article from ADMIN 58/2020
By
We look at how to determine the performance of a segment of code.

As soon as your code starts working, and perhaps even before it does, the engineer's brain naturally drifts toward making it faster. These brave thoughts are premature if the program's architecture is not yet fully settled, but once it is, the critical question becomes just how fast a segment of code runs. Measurement is critical to figuring out what part of the code is just not running fast enough for the program's aims.

Crawling Python

The timeit [1] module provides a simple way to measure the performance of short code segments. Including both callable and command-line interfaces, timeit is the first stop for most users when it comes to measuring the speed of Python code. Figure 1 shows timeit in use in an interactive Python environment, comparing the performance of the round implementations found in the standard Python built-ins [2] and in the NumPy library [3].

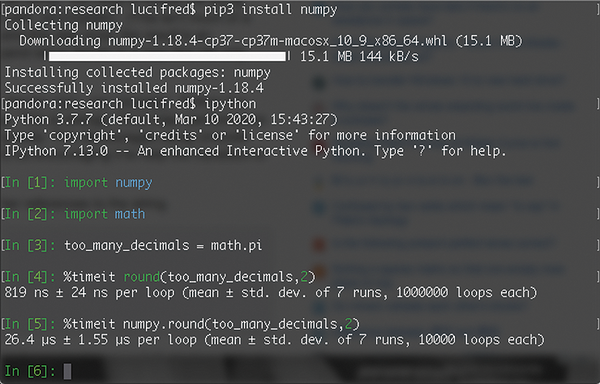
Figure 1: IPython session comparing two implementations of a round routine.

Unless you specify otherwise, timeit automatically selects the appropriate number of tests to yield statistically significant measurements and may detect caching behavior by observing the spread of outlying samples. As the test shows, in this case, the difference between the performance of the two implementations is two orders of magnitude (closing on one if you squint hard enough).

Most code segments worth benchmarking are not one-liners and are more easily benchmarked as a function, as is shown in Figure 2. The callable interface to the timeit function provides control of the number of times a test is repeated and an opportunity to execute one-time setup code, like importing modules. Concatenating strings is an interesting performance exercise in most dynamic languages, because it will cause at least memory reallocation once an allocation limit is exceeded and, at worst, a redefinition every time, if the type implementation is immutable [4]. Triggering garbage collection is usually not far behind (see the box titled "The Garbage Collection Factor"). Python shows interesting behavior in different runtimes, and Unicode strings are a good area to explore if you feel so inclined.

Figure 2: The timeit function in action on a function, with setup import statements [5].

The Garbage Collection Factor

By default, timeit turns off garbage collection during benchmarking. The benefit of this approach is that it makes measurements more consistent. The trade-off is that garbage collection pauses may be a relevant factor in the performance of the function being measured – the most significant effect being the case in which the function itself performs so much memory allocation that it directly causes garbage collection as part of its operation. In such cases, garbage collection can be re-enabled as the first statement of the setup parameter with gc.enable().

Heisenberg's Law

Heisenberg's law of profiling [6] holds that measuring a computing system alters it. How am I altering the system to measure it? Different tools leave different fingerprints, but all software performance tools leave their traces in the data they generate. Recognize that all measurement introduces bias, but although instrumentation changes runtime and compile-time properties, don't accept speculation about the performance of any code; instead, insist on verifying it through measurement.

Jens Gustedt in his book Modern C [7] analyzed the effect of measurement on performance through clever experiments that determined the effect of time measurement on the code measured. Using well-placed calls to timespec_get [8] and a detailed understanding of C compilers, Jens showed that time measurement and statistics collection have overheads of the same order of magnitude – at least on his machine, with code provided to verify the same assertion on others' machines.

Benching C

With routines from Jens' book [9] and a bit of your own code, you can easily accomplish statistically weighted measurements of code performance in C similar to that provided by timeit in Python: Extract timespec.c, stats.c, and stats.h from the book's source tarball, and compile it with:

cc timespec.c stats.c -o timespec -lm

You will want to read Chapter 15 in the book to understand fully the analysis of those seven measurements (Figure 3) and how they lead to the aforementioned conclusion about time and stats. Returning to the focus on measurement, you want to use the plumbing of this example by replacing timespec.c with the contents of Listing 1. After a quick recompile, run the code with,

./timespec 100000
Figure 3: A run of Jens' tests (see Chapter 15 of his book [7] to unpack their full meaning).

Listing 1

timespec.c

01 // timespec.c: benchmark a code snippet
02 // (c) 2016-2019 by Jens Gustedt, MIT License
03 // (c) 2020 by Federico Lucifredi
04
05 #include <stdint.h>
06 #include <stdio.h>
07 #include <stdlib.h>
08 #include <stddef.h>
09 #include <time.h>
10 #include <tgmath.h>
11 #include <math.h>
12
13 #include "stats.h"
14
15 double timespec_diff(struct timespec const* later, struct timespec const* sooner){
16   /* Be careful: tv_sec could be an unsigned type */
17   if (later->tv_sec < sooner->tv_sec)
18     return -timespec_diff(sooner, later);
19   else
20     return
21       (later->tv_sec - sooner->tv_sec)
22       /* tv_nsec is known to be a signed type. */
23       + (later->tv_nsec - sooner->tv_nsec) * 1E-9;
24 }
25
26 int main(int argc, char* argv[argc+1]) {
27   if (argc < 2) {
28     fprintf(stderr, "Usage: %s NNN, NNN iterations\n",
29             argv[0]);
30     return EXIT_FAILURE;
31   }
32
33   enum { probes = 10, loops = 1, };
34   uint64_t iterations = strtoull(argv[1], 0, 0);
35   uint64_t upper = iterations*iterations;
36
37   double pi = M_PI;
38   double r = 0.0;
39
40   stats statistic[loops] = { 0 };
41
42   struct timespec tdummy;
43   stats sdummy[4] = { 0 };
44
45   for (unsigned probe = 0; probe < probes; ++probe) {
46     uint64_t accu0 = 0;
47     uint64_t accu1 = 0;
48     struct timespec t[loops+1] = { 0 };
49     timespec_get(&t[0], TIME_UTC);
50     /* Volatile for i ensures that the loop is effected */
51     for (uint64_t volatile i = 0; i < iterations; ++i) {
52    r = round(pi);
53     }
54     timespec_get(&t[1], TIME_UTC);
55
56     for (unsigned i = 0; i < loops; i++) {
57       double diff = timespec_diff(&t[i+1], &t[i]);
58       stats_collect2(&statistic[i], diff);
59     }
60
61   }
62
63   for (unsigned i = 0; i < loops; i++) {
64     double mean = stats_mean(&statistic[i]);
65     double rsdev  = stats_rsdev_unbiased(&statistic[i]);
66     printf("loop %u: E(t) (sec):\t%5.2e ± %4.02f%%,\tloop body %5.2e\n", i, mean, 100.0*rsdev, mean/iterations);
67   }
68
69   return EXIT_SUCCESS;
70 }

on the DigitalOcean droplet I have been using to write this column, repeating the measurement 100,000 times leads to an approximate time measurement of 6ns for the round n

Figure 4: Bench testing round() in C: 6.23ns fast.

Infos

  1. timeit module: http://[https://docs.python.org/3/library/timeit.html]
  2. round(): http://[https://docs.python.org/3/library/functions.html#round]
  3. NumPy library: http://[https://numpy.org/doc/]
  4. Performance comparison of immutable string concatenation between Java and Python: http://[https://stackoverflow.com/questions/3901124/performance-comparison-of-immutable-string-concatenation-between-java-and-python]
  5. Code for this article: ftp://ftp.linux-magazine.com/pub/listings/admin-magazine.com/Ad58]
  6. "Linux Profiling and Optimization" by Federico Lucifredi, Princeton PICASso Lecture, February 2007: https://www.cs.princeton.edu/picasso/mats/mats_S07/Lucifredi_Lecture_Feb07.pd]
  7. Gustedt, Jens. Modern C. Manning, 2019: http://[https://www.manning.com/books/modern-c]
  8. timespec_get standard C11 library call: http://[https://en.cppreference.com/w/c/chrono/timespec_get]
  9. Gustedt, Jens. Modern C code examples: http://[https://modernc.gforge.inria.fr]
  10. C round( ) functions: https://en.cppreference.com/w/c/numeric/math/roun]
  11. Feynman, Richard. There's Plenty of Room at the Botto m: http://users.eecs.northwestern.edu/~kch479/docs/feynman_bottom.pd]
  12. Ryan, Mike, and Federico Lucifredi. AWS System Administratio n. O'Reilly Media, 2018.

The Author

Federico Lucifredi (@0xf 2) is the Product Management Director for Ceph Storage at Red Hat, formerly the Ubuntu Server Product Manager at Canonical, and the Linux "Systems Management Czar" at SUSE. He enjoys arcane hardware issues and shell-scripting mysteries and takes his McFlurry shaken, not stirred. You can read more from him in the new O'Reilly title AWS System Administratio n [12].

Buy this article as PDF

Express-Checkout as PDF
Price $2.95
(incl. VAT)

Buy ADMIN Magazine

SINGLE ISSUES
 
SUBSCRIPTIONS
 
TABLET & SMARTPHONE APPS
Get it on Google Play

US / Canada

Get it on Google Play

UK / Australia

Related content

comments powered by Disqus
Subscribe to our ADMIN Newsletters
Subscribe to our Linux Newsletters
Find Linux and Open Source Jobs


Support Our Work

ADMIN content is made possible with support from readers like you. Please consider contributing when you've found an article to be beneficial.

Learn More”>
	</a>

<hr>		    
			</div>
		    		</div>

		<div class=