Photo by Quino Al on Unsplash

Photo by Quino Al on Unsplash

Analyzing tricky database problems

Set Theory

Article from ADMIN 44/2018
By
Database administrators at the Swiss foundation Switch were increasingly encountering corrupt data, which prompted a painstaking bug hunt. The solution they found increased performance by a factor of six.

Troubleshooting complex cloud infrastructures can quickly look like finding the proverbial needle in a haystack. Nevertheless, the effort can be worthwhile, as shown by a practical example at the Swiss foundation Switch. The foundation has been organizing the networking of all Swiss university IT resources for more than 30 years [1]. In addition to Swiss universities, the Switch community also includes other institutions from the education and research sectors, as well as private organizations (e.g., financial institutions or industry-related research institutions).

Because of its high degree of networking, Switch depends on a powerful cloud infrastructure. The foundation provides tens of thousands of users with the Switch Drive file-sharing service, which is based on ownCloud, is hosted 100 percent on Swiss servers, and is used mainly for synchronizing and sharing documents (Figure 1).

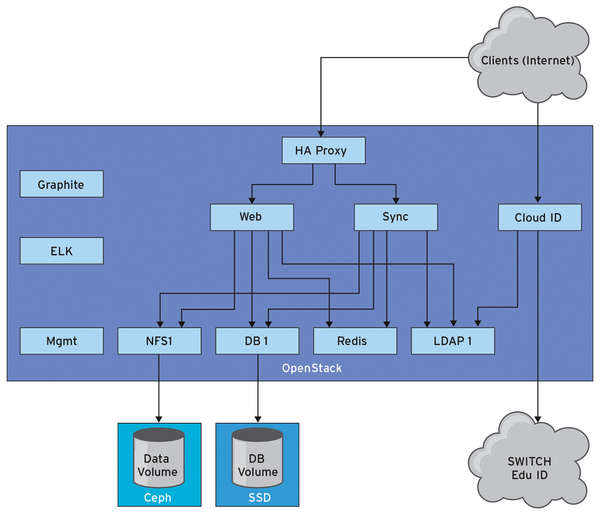
Figure 1: Overview of the Switch server infrastructure.

Switch Drive is essentially an ownCloud offering under the Switch brand that manages 30,000 users and about 105 million files. The oc_filecache table contains about 100 million lines. To manage this high number, six MariaDB servers [2] are used in Galera Cluster [3], and hosting is handled by nine Apache servers (four each for sync and web and one for management). Switch uses Redis [4] as its key-value store. The infrastructure also includes three LDAP servers, six NFS servers (based on Ceph), and two HAProxy load balancers. Monitoring is done via Graphite [5], with an Elasticsearch [6], Logstash [7], and Kibana [8] (ELK) stack.

All database nodes comprise separate Docker containers [9], which in turn run on virtual machines (VMs) provided by OpenStack [10]. What seems overly complicated at first glance offers the admins a great deal of flexibility: Containers can be updated and patched easily, and the admins can revert quickly to a previous state should problems arise. OpenStack's VMs can easily be moved back and forth between compute nodes. The slight performance hits that occur in the process are compensated for by having twice the flexibility.

To use a multimaster setup within the database, the admins moved from PostgreSQL to Galera Cluster, to enjoy the benefits of fully retained functionality when a server is removed from the cluster. Another system then automatically assumes its role and hands it back after the original server has been restored.

Although the database cluster solved urgent problems, it unfortunately also created new ones. The admins observed massive performance hits in the ownCloud instance; the discrepancy between write and read load was particularly noticeable. To deal with the flood of requests, the admins distributed access across nodes that are either read only or write only. In the end, they had up to five read nodes for every write node in the six-node cluster.

The MaxScale database proxy handles the distribution of queries between the two types of database nodes, which has the added benefit that the proxy is still able to distribute read requests correctly to the read nodes, even if they are no longer fully in use (e.g., when some are logged off for maintenance tasks). All write requests are sent to the master server, and all reads are sent to the replicas. Switch currently uses MaxScale v1.4, because the new version (2.1) is subject to license fees.

First Traces

The administrators now suspected that MaxScale was the source of their troubles. MaxScale provides a number of tools to help narrow down such problems, including the MaxScale Top Queries filter, MySQL Performance Schema [11], and the Explain and Analyze tools.

The MySQL Performance Schema Events Statements Summary by Digest view provides a summary of the most frequently used statements and their run times. For example, admins can see which types of instructions the server executes and how often, and which are the most time-consuming instructions. The Performance Schema also contains many other tables with a wide range of information that can be reset. However, with MariaDB 10.0.12, the performance tables are deactivated by default. To activate them, the database admin adds the line

performance_schema=on

to the my.cnf file. Detailed instructions are available online [12].

Another possibility is analysis with MaxScale Top Queries. The tool offers a top 10 summary filter for a specific session. The filter module monitors every SQL statement that passes through the filter, measuring the duration of the statement as the time between sending the statement and the first result returned.

These times are cached together with the SQL text itself and written to a file in a list sorted by the execution times of the query when the client session is closed. The results of an analysis of the Switch database with MaxScale Top Queries is shown in Listing 1.

Listing 1

MaxScale Top Queries Results

01 [root@drive-mgmt1 sessions]# cat top10.1181
02 Top 10 longest running queries in session.
03 ==========================================
04 Time (sec) | Query
05 -----------+------------------------------------------------------------
06      0.078 | SELECT `oc_share`.`id`, `item_type`, `item_source`, `item_target`,`oc_share`.`parent`, `share_type`, `share_with`, `uid_owner`,`file_source`, `path`, `file_target`, `oc_share`.`permissions`,`stime`, `expiration`, `token`, `storage`, `mail_send`,`oc_storages`.`id` AS `storage_id`, `oc_filecache`.`parent` as `file_parent` FROM `oc_share` INNER JOIN `oc_filecache` ON `file_source` = `oc_filecache`.`fileid` AND `file_target` IS NOT NULL INNER JOIN `oc_storages` ON `numeric_id` = `oc_filecache`.`storage` AND ((`share_type` in ('0', '2') AND `share_with` = 'username@switch.ch') ) AND `uid_owner` != 'username@switch.ch' ORDER BY `oc_share`.`id` ASC
07      0.040 | INSERT INTO `oc_preferences` (`userid`, `appid`, `configkey`, `configvalue`) VALUES('username@switch.ch', 'user_ldap', 'homePath', '')
08      0.018 | COMMIT
09      0.013 | START TRANSACTION
10      0.012 | SELECT `fileid`, `storage`, `path`, `parent`, `name`, `mimetype`, `mimepart`, `size`, `mtime`, storage_mtime`, `encrypted`, `etag`, `permissions`, `checksum` FROM `oc_filecache` WHERE `storage` = '4231' AND `path_hash` =
11 [...]
12 -----------+------------------------------------------------------------
13 Session started Wed Aug 30 06:14:49 2017
14 Connection from localhost_from_socket
15 Username        owncloud
16
17 Total of 14349 statements executed.
18 Total statement execution time  13.645 seconds
19 Average statement execution time        0.001 seconds
20 Total connection time   79.461 seconds

The first five queries comprise one SELECT, one INSERT, one COMMIT, one START TRANSACTION, and a further SELECT. The analysis also provides information on how long each query took. The results were reproducible. As a result, the problematic request in Listing 2 was identified because its response times were particularly noticeable.

Listing 2

Problematic Request

01 SELECT `oc_share`.`id`, `item_type`, `item_source`, `item_target`,`oc_share`.`parent`, `share_type`, `share_with`, `uid_owner`,`file_source`, `path`, `file_target`, `ocshare`.`permissions`, `stime`, `expiration`, `token`, `storage`, `mail_send`,`oc_storages`.`id` AS `storage_id`, `oc_filecache`.`parent` as `file_parent`
02 FROM `oc_share`
03 INNER JOIN `oc_filecache`
04 ON `file_source` = `oc_filecache`.`fileid`
05 AND `file_target` IS NOT NULL
06 INNER JOIN `oc_storages`
07 ON `numeric_id` = `oc_filecache`.`storage`
08 AND ((`share_type` in ('0', '2')
09 AND `share_with` = 'username@switch.ch') )
10 AND `uid_owner` != 'username@switch.ch'
11 ORDER BY `oc_share`.`id` ASC

The bottleneck was identified, followed by its analysis. The SQL EXPLAIN tool helped by providing an estimate from the database optimizer as to what plan and at what cost the database handles the query. EXPLAIN EXTENDED calculates the percentage of time consumed by table rows, which can be filtered with a particular condition, and provides information on how many intermediate steps are required within a database to arrive at a specific result.

The tool also indicates whether a filter was sorted and whether a filter (e.g., a WHERE condition) or index was used. To generate as much information as possible, output in the JSON format (EXPLAIN FORMAT=JSON) provides more data in MariaDB than simple MySQL EXPLAIN statements.

Finally, the ANALYZE TABLE function, which can rearrange an index (unlike EXPLAIN), is also helpful. This function recalculates the statistics that the optimizer uses to execute a query. The command is possible for every query for which EXPLAIN can also be used. ANALYZE starts the optimizer, executes the query, and returns the corresponding results. It's slower than EXPLAIN but supplies more detailed information about what happens to the data.

If the database has a serious problem that might be caused by the optimizer, it is best to localize it with another statement: EXPLAIN ANALYZE.

Analysis

In the case of the Switch database, at least, the results were clear. The analysis showed that the Switch database was scanning the complete oc_share table each time (i.e., 70,305 rows). The database then filtered the output of the results into a JOIN table in which it called a WHERE clause. This query also represents the top query in this case, as shown by MaxScale.

Although this situation would not be a problem if a query were to execute only occasionally, this query was one of the most frequent requests, and executing this scan took 0.078 seconds each time. These times added up, which eventually led to a high load on the database servers.

During further investigations, the admins came across an astonishing effect: If this query were executed without an index, the response times would be significantly lower. Usually it is the other way around: An index speeds up access, especially compared with a full table scan. In this case, however, the problem lay in the use of the WHERE clause, which contains a value that is not found in the index itself, but in the raw data. The ORDER BY clause uses the primary key to obtain the desired order, which means that sequential reads can no longer be used, so randomly distributed read access to the raw data led to poorer performance than with a full table scan.

Examining Indexes

To understand what problems a faulty index in a database can cause, it is useful to recall its role. Basically, an index is a key-value store that uses one or more columns as keys to retrieve rows from a database table. In a sense, indexes act as abbreviations within a database. On the one hand, a missing index can slow down a database considerably, but on the other hand, unused or rarely used indexes also consume resources. When an index is added, a table is locked during the operation.

Indexes also help where tables need to be joined. Usually this is done on the basis of common data in a column. Here, too, indexes ensure that the process is as fast and efficient as possible. Adding indexes to the filters is also advisable.

In the worst case, however, an incorrectly indexed connection can lead to a Cartesian product that then returns a complete record of all possible combinations of data in both tables. Filters can process this result correctly, but they need a multiple of the resources that would be necessary with correct indexing.

Just like having the wrong index, a missing index can cause performance problems, and the admins also observed this case at Switch. A huge number of values were returned because an index was missing. After this index was created, the database returned exactly one line instead of 70,305 lines.

The Grafana analyses in Figures 2 and 3 show the new situation for resource consumption and performance after the elimination of errors.

Figure 2: The average response time after the elimination of errors decreased from 3ms to about 0.15ms.
Figure 3: After the fix, CPU utilization dropped from 1,200 to 200 percent.

The average response time of the read nodes decreased from 3ms to about 0.15ms. The CPU utilization of the database dropped from 1,200 to 200 percent. The database infrastructure became significantly more stable. The cloud cron jobs were also faster afterward. Switch was able to reduce the number of database servers to three, which consume significantly fewer resources than before, with a database read node response time of approximately 0.2ms.

Buy this article as PDF

Express-Checkout as PDF
Price $2.95
(incl. VAT)

Buy ADMIN Magazine

SINGLE ISSUES
 
SUBSCRIPTIONS
 
TABLET & SMARTPHONE APPS
Get it on Google Play

US / Canada

Get it on Google Play

UK / Australia

Related content

comments powered by Disqus
Subscribe to our ADMIN Newsletters
Subscribe to our Linux Newsletters
Find Linux and Open Source Jobs


Support Our Work

ADMIN content is made possible with support from readers like you. Please consider contributing when you've found an article to be beneficial.

Learn More”>
	</a>

<hr>		    
			</div>
		    		</div>

		<div class=