One Metric to Rule Them All
The load average is one of the most iconic system status metrics of the Unix world. It is readily available on any Unix-inspired system and is so pervasive that a multitude of tools provide it – too many to cover here. Yet, it remains a recurring source of user questions. This month, almost as a public service announcement, I will dig head first into the subject.
Arbitrarily, I’ll first look at the output of uptime [1] on OS X:
13:03 up 2 days, 12:01, 2 users, load averages: 0.52 0.59 0.63
The uptime command displays the load average in its common form, averaging the last one, five, and 15 minutes of the system’s load. A plethora of tools display this metric, which is typically sourced through the getloadavg(3) [2] system call, but the Linux kernel provides a canonical filesystem source for it at /proc/loadavg/ [3]:
1.00 0.97 0.94 1/1279 7743
The three additional numbers provided by Linux are the number of running processes (one in this case), the total number of processes, and the last process ID (PID) used.
When discussing load averages, you need to interpret the term “running” in the narrowest of senses – that is, a process actually executing in the processor at the moment in question. Remember that a multitasking OS provides processes with the illusion of a dedicated CPU.
In reality, however, multiple processes are being continuously swapped in and out of execution on a single processor core using a kernel-specific version of the state machine described in Figure 1.
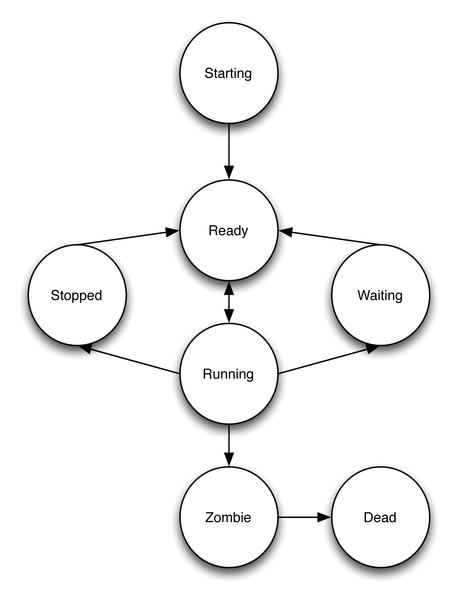 Figure 1: Process state transitions.
When a process is context-switched out of execution, the operating system puts it in a holding state patterned on the reason for that context switch. The common routine for a process is to be put into a state in which it is waiting for I/O while another process runs and then to resume execution once the necessary data arrives.
Another common occurrence for CPU-bound processes is for their time slice to expire and the kernel to preempt them. These processes are still ready to run, but for fairness, the kernel needs to schedule other processes for execution first before they get another go.
Notice how processes that are running and processes ready to run (just not running now) are conflated into the same state in the Linux kernel’s version of this state diagram (Figure 2).
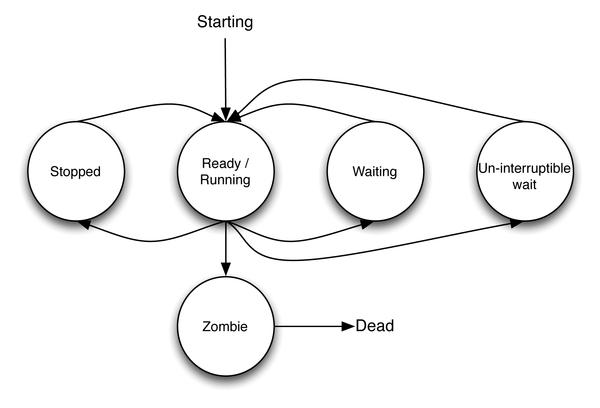 Figure 2: Linux process state diagram.
One now can meaningfully state what the load average samples and takes the average of: the number of processes in the run queue, ready to run but waiting for a time slice of the processor, plus the number of processes currently actually running.
The kernel samples this data at some predefined time and calculates running averages for these numbers, which are then published to userspace. There is some variance between different Unix kernels, but I won’t go into that here; indeed, some illustrious authors have called the metric “simplistic, poorly defined, but far from useless” [4].
An idle system therefore has a load of 0 by definition. A load equal to the number of cores describes a system never idle, with CPU contention starting as the number rises higher. A common practice is to look at the load average as a measure of CPU utilization, but the real picture is more complex. Examining the recently updated kernel code involved in computing [5] the moving average is even more so.
Pragmatically, I’ll examine the response of my laptop to:
watch cat /proc/loadavg
0.03 0.03 0.07 1/362 23038
This is what an idle system looks like. When examining load average numbers, you should also be aware of how many cores a system has because that will alter the system’s reaction to load changes. Using stress [6], you can create purely CPU-bound tasks to target a specific system load:
stress --cpu 3
Spawning three such tasks makes the system progressively converge on a load average of 3 as time passes:
2.98 2.12 0.96 4/383 9433
By interpreting these numbers, you can say that, in that past minute, on average, one process (2.98 on two cores) had to wait while ready to run, but over the past 15 minutes, the system was (again, on average) not making processes wait for the CPU (Figure 3).
 Figure 3: The tload tool [7] graphs system load averages in the terminal.
Info
[1] Uptime man page (search on “uptime” if it doesn’t redirect): [https://developer.apple.com/library/mac/#documentation/Darwin/Reference/ManPages/man1/uptime.1.html]
[2] Getloadavg (3) man page: [http://www.kernel.org/doc/man-pages/online/pages/man3/getloadavg.3.html]
[3] CentOS Deployment Guide – /proc/loadavg: [http://www.centos.org/docs/5/html/5.2/Deployment_Guide/s2-proc-loadavg.html]
[4] Peek, Jerry, Shelly Powers, Tim O’Reilly, and Mike Loukides. UNIX Power Tools. O’Reilly Media, 2002
[5] sched.h: [https://patchwork.kernel.org/patch/1162981/]
[6] Amos Waterland – stress: [http://weather.ou.edu/~apw/projects/stress/]
[7] tload: [http://manpages.ubuntu.com/manpages/natty/man1/tload.1.html]
The Author
Federico Lucifredi is the maintainer of man(1) and the Ubuntu Advantage and Landscape Product Manager at Canonical. He enjoys arcane hardware issues and shell-scripting mysteries and takes his McFlurry shaken, not stirred.
Related content
-
One metric to rule them all
 The load averaging can be a source of confusion for admins. This month, we provide a look at some basic considerations.
 -
Processor and Memory Metrics

One goal of HPC administration is effective monitoring of clusters. In this article, we talk about writing code that measures processor and memory metrics on each node.
-
Turning machine state into a database
 Learn how the osquery tool exposes system state in searchable form.
 -
Exploring the filesystem that knows everything
 Nearly everything you need to know about your system is stored somewhere in the /proc filesystem.
 -
Exploring the most famous performance tool
 Take your performance tuning into the cloud with the top utility.
Subscribe to our ADMIN Newsletters
Subscribe to our Linux Newsletters
Find Linux and Open Source Jobs
Most Popular
Focus On Self-Hosting
• Self-Hosted Collaboration with Forgejo
• Self-Hosted PaaS with Coolify
• Build and Host Docker Images
• Self-Hosted Pritunl VPN Server with MFA
• Self-Hosted Chat Servers
Support Our Work
ADMIN content is made possible with support from readers like you. Please consider contributing when you've found an article to be beneficial.
