Lead Image © Lucy Baldwin, 123RF.com

Lead Image © Lucy Baldwin, 123RF.com

Exploring the most famous performance tool

Waking Up the Neighbors

Article from ADMIN 46/2018
By
Take your performance tuning into the cloud with the top utility.

The top command [1] is always the first stop in any performance quest on any *nix system. If things somehow feel slow, the first thing to do is launch top without even thinking. To honor this widely used but often not fully understood jack of all trades, I dissect the capabilities of top in several sessions this year. Welcome to the Dojo!

The Top Line

Multiple versions of the command are in common use across Linux and BSD distributions. Figure 1 shows top version 3.3 on a stock Fedora system. The first line of the dynamically updated display lists the current time, the system's uptime, the number of logged-in users, and the load average [2]. If you were to launch the uptime [3] command with no options, you could see a curiously similar output:

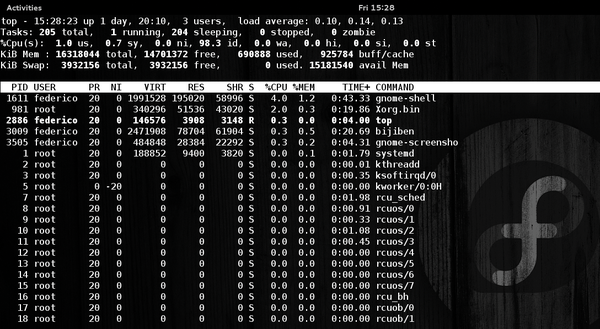
Figure 1: The top command on a Linux system.
15:28:23 up 1 day, 20:10, 3 users, load average: 0.10, 0.14, 0.13

The second line of the display lists the aggregate state of the system's processes – 205 in all, with 1 running and 0 zombies. I discussed process states in Dojo article 5 [2], so you can refer to that issue in your ADMIN collection if you need a refresher. The fourth and fifth lines show available and free memory, including buffer/cache allocations [4] and the state of swap [5].

Most useful is the avail Mem field, which estimates memory available to new processes without making use of swap. Unlike the free field, avail Mem uses the kernel's own accounting of readily reclaimable page cache and memory slabs introduced by kernel 3.14. Several run-time options enable the customization of the summary area (Table 1); for example, try switching the CPU or memory summaries to the bargraph view on a busy system: It can be quite intuitive (Figure 2).

Table 1

Summary Area Run-Time Commands

Keystroke Action
E Toggle memory scale from kibibytes (KiB) all the way to exbibytes (EiB).
1 Split the %Cpu summary line into individual core entries.
2 Add a %Cpu line of statistics per NUMA node alongside the summary.
3 Expand a specific NUMA node.
t Four-way toggle of task and CPU state. Second and third state replace summary with bargraphs.
m Four-way toggle of memory state. Second and third state replace summary with bargraphs.
l Load average toggle; toggles off the first line of the summary area.
Figure 2: Summary area with CPU stats expanded per-core and set to bargraph mode.

Stolen CPU Time

The third line of the top output does not get all the attention it deserves: Alongside the traditional CPU shares of us (er), sy (stem), id (le), ni (ce), and (I/O) wa (it), the EC2 hypervisor exposes non-zero values in the st metric, standing for stolen:

%Cpu(s): 0.1 us, 0.1 sy, 0.1 ni, 98.2 id, 1.0 wa, 0.0 hi, 0.0 si, 0.5 st

In a cloud environment, like Amazon AWS, stolen CPU time represents the share of time the instance's virtual CPU has been waiting for a real CPU while the hypervisor is using it to service another virtual processor. Stolen CPU has gained prominence as a metric that Netflix, possibly the most famous among AWS tenants, is reported to track closely. Despite its transient fame, stolen CPU is not as significant for workloads that are not sensitive to network jitter or that are not real-time in nature.

The Noisy Neighbor is a related term of art: In any virtual environment, the noisy neighbor effect occurs when an instance starves other instances for a shared resource, causing performance issues to others running on the same infrastructure. You are not likely to observe memory or CPU contention on AWS. Because EC2 instances are generally not over-provisioned, any potential noisy neighbor problems will be limited to network or disk I/O.

One simple approach countering this issue is to allocate a new instance automatically, replacing the one where the performance problem was encountered. In a public cloud, larger instance types are less likely to present this problem on account of sharing a host with fewer neighbors. Single root I/O virtualization (SR-IOV) support (enhanced networking) increases storage and network I/O bandwidth, helping to minimize any noise. The ultimate solution is to use dedicated hosts, a facility providing complete control of your instance placement but at an additional cost.

The House of Mac

Unlike the Linux version, the Mac OS version of top makes full use of terminals wider than 80 columns in its default setup (Figure 3). Originating in the early versions of BSD, it was first ported to Mach in 1988, then to NeXTSTEP in 1990, and finally to Mac OS in 1999. Somewhat oddly, this version is not set up to sort processes by CPU utilization by default, sorting instead by process ID (calling top -u will do it).

Figure 3: The top command as featured in Mac OS.

In the Mac world, the summary area is called global state [6], and memory regions are adjusted to match the Mach kernel's modeling of these resources [7]. You cannot identify lines as unique in this port, because its aforementioned terminal width awareness causes line-wrapping or merging adjustments accordingly, but it is worth noting the additional Disks and Networks sections with aggregate I/O statistics. Conspicuously absent is the uptime information, which for this system was 48 days when it was run, explaining the outsize I/O aggregate figures.

I hope to have helped you become familiar with some of the more advanced features of top, so you can go beyond seeing it merely as a quick overview of system state. This tool offers a lot of features, and one I will be sure to revisit.

Infos

  1. Man page for top(1): https://linux.die.net/man/1/top
  2. "Law of Averages" by Federico Lucifredi, ADMIN , issue 11, 2012, pg. 94
  3. man page for uptime(1): https://linux.die.net/man/1/uptime
  4. "Tune-Up" by Federico Lucifredi, ADMIN , issue 7, 2012, pg. 81
  5. "Swap Tricks" by Federico Lucifredi, ADMIN , issue 9, 2012, pg. 83
  6. Man page for top(1), Darwin version: https://developer.apple.com/library/archive/documentation/Darwin/Reference/ManPages/man1/top.1.html
  7. The Mac OS virtual memory system: https://developer.apple.com/library/archive/documentation/Performance/Conceptual/ManagingMemory/Articles/AboutMemory.html

The Author

Federico Lucifredi is the Product Management Director for Ceph Storage at Red Hat, formerly the Ubuntu Server PM at Canonical, and the Linux "Systems Management Czar" at SUSE. He enjoys arcane hardware issues and shell scripting mysteries, and takes his McFlurry shaken, not stirred. You can read more from him in the new O'Reilly title AWS System Administration .

Buy this article as PDF

Express-Checkout as PDF
Price $2.95
(incl. VAT)

Buy ADMIN Magazine

SINGLE ISSUES
 
SUBSCRIPTIONS
 
TABLET & SMARTPHONE APPS
Get it on Google Play

US / Canada

Get it on Google Play

UK / Australia

Related content

comments powered by Disqus
Subscribe to our ADMIN Newsletters
Subscribe to our Linux Newsletters
Find Linux and Open Source Jobs


Support Our Work

ADMIN content is made possible with support from readers like you. Please consider contributing when you've found an article to be beneficial.

Learn More”>
	</a>

<hr>		    
			</div>
		    		</div>

		<div class=