


Read this article on our new ADMIN website
https://www.admin-it.io/empowering-kubernetes-capabilities-with-lightweight-k8s-distros/
Empowering Kubernetes capabilities with lightweight K8s distros
Small Wonders
Control Plane and Security
k0s optimizes control plane isolation by completely disallowing workloads on the management nodes and by limiting the system services running on them. This clear separation and streamlined connectivity make k0s a strong candidate for deployments where minimalism, security, and ease of use are key, particularly in edge computing or IoT environments. Security is handled by k0s as follows:
Bare-bones management. Only the essential control plane components run on the management (control plane) nodes. This minimalistic approach focuses solely on running core control plane services, which are necessary to manage the cluster. This term also refers to how k0s runs as a simple Linux process that does not rely on extra system services like containerd or kubelet on the control plane, which keeps the setup lightweight and ensures that the control plane isn't burdened with unnecessary background services. Streamlining means only the absolutely necessary components are running, reducing both complexity and the resource footprint.
Simplified connectivity between control plane and worker nodes. Traditional Kubernetes clusters might require that several different ports be open for communication between control plane nodes and worker nodes, which increases the complexity of network configuration and the attack surface. k0s simplifies with: (1) Single-port communication, wherein k0s, the control plane, and worker nodes communicate through a single port, significantly simplifying network management and reducing the need to configure multiple firewall rules. (2) A lightweight connectivity agent that handles communication between the control plane and worker nodes in k0s and takes care of establishing and maintaining the connection between these components without relying on heavy or complex networking configurations.
Security improvements. k0s inherently improves security by reducing the number of open potential entry points for attackers to just one, thus reducing the attack surface, which is particularly important in edge computing and IoT scenarios, where clusters might be deployed in less secure environments and exposed to the public Internet. You only need to manage rules for one port, which decreases administrative overhead and reduces the chance of misconfigured network security settings, thus simplifying the firewalls rules.
To verify the security ports used and check whether k0s is minimizing the number of open ports, you can use a few commands (Listing 1) that inspect the network and firewall configuration on your system. These commands can help you confirm whether only one port is open and whether network traffic is being managed properly. To check the open ports on your system, you can display a list of open TCP and UDP ports and inspect the configuration to verify which ports are explicitly open. For additional verification, you can use tools like nmap to scan for open ports. Also, you can ensure your firewall configuration is properly configured by current firewall rules to allow only the necessary ports for k0s.
Listing 1
Verifying Security
# Look for k0s-related ports to ensure only one is in use
sudo ss -tuln
# Confirm that only the required port (typically the API port) is open
sudo iptables -L -n -v
# Determine open and blocked ports
sudo ufw status
# Verify open ports
cat /etc/k0s/k0s.yaml | grep port
# Scan for open ports
sudo nmap -p- localhost
Control and Data Plane Performance Comparison
Research at ABB Corporate Research [5] on lightweight distributions like k0s, K3s, MicroK8s, and MicroShift looked at the computational behavior in different situations for different processes with the K-Bench benchmark (Figure 3). The upper row shows the throughputs for individual pod creations (i.e., eight pods in parallel), as well as the pod creation average latency. This value shouldn't be confused with pod startup latency, because here it is computed by subtracting the pod creation timestamp from the first timestamp of the scheduling event associated with the pod, which excludes the phase after pod creation before the pod's status changes to Running . K3s marginally shows the highest throughput and lowest latency, although MicroK8s and k0s are not far off (about 15 percent difference). The results for MicroShift are not directly comparable because the pods were created on a single node and could not be distributed in a cluster of three nodes.
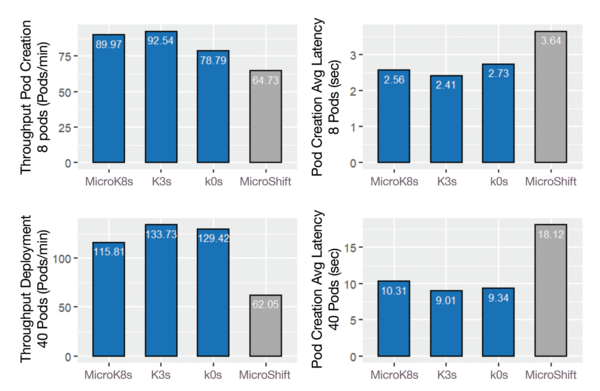 Figure 3: Pod creation throughput and latencies (eight clients). MicroShift was tested on a single combined controller/worker node; therefore, the measurements are not directly comparable to the others.
The lower row shows the same metrics for starting a deployment of 40 pods (i.e., around 13 pods per node). Again, K3s barely shows the highest throughput and lowest latency, although the differences are even less pronounced. Compared with the former eight-pod creation, the latencies go up from 2-4 seconds to 9-18 seconds for all distributions, indicating the aforementioned queueing effects.
Figure 4 visualizes latencies when creating, deleting, getting, listing, and updating a K8s deployment resource. K-Bench reports just the minimum, median, and maximum values. These operations only cause data operations on the controller nodes and are independent of the number of nodes used. Here, the MicroShift results are meaningful. The create and delete operations by far show the highest latencies, whereas the get, list, and update operations are much shorter. MicroK8s shows the highest latencies, with delete operations going up to a maximum of 470ms. The differences are likely caused by the different control plane data stores (e.g., MicroK8s uses Dqlite and K3s uses SQLite). k0s was significantly faster in deleting a deployment compared with the other distributions.
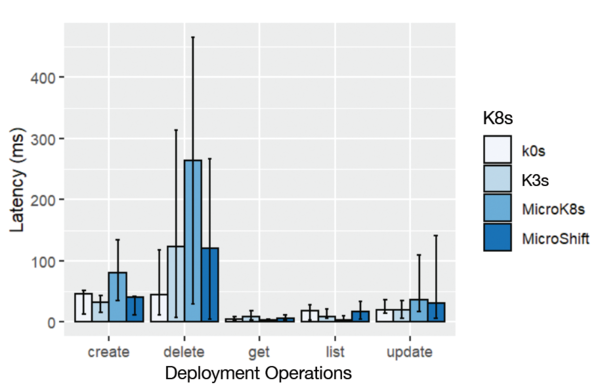 Figure 4: Latency (minimum, median, and maximum) during deployment operations (eight clients, 40 pods).
The results were extended by running a workload three times as heavy to determine how the throughputs and latencies were affected. The results in Figure 5 are from a separate series of K-Bench experiments, now starting 24 pods in parallel, as well as starting a more extreme scenario of 120 pods in parallel (i.e., 40 pods per node). The pod creation throughput increased to a maximum of 152 pods/min (k0s), with pod creation latency increasing up to 37.7 seconds (MicroK8s). K3s and k0s show significantly higher throughputs and lower latencies than MicroK8s.
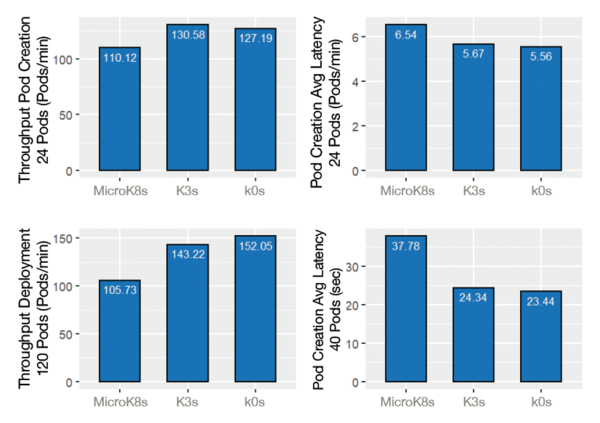 Figure 5: Performance comparison of lightweight Kubernetes distributions (MicroK8s, K3s, and k0s) in terms of pod creation and deployment. K3s and k0s demonstrate higher throughput and lower latency compared with MicroK8s.
The latter experiments also recorded the pod operation latencies (Figure 6). Under the higher workload, the latencies are significantly higher than for the deployment operations before, but a similar profile again is visible, with MicroK8s showing the longest creation and deletion latencies and k0s and MicroShift having the shortest latencies.
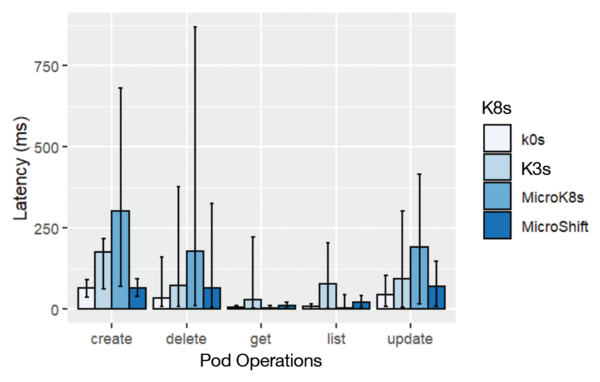 Figure 6: Latency behavior of different Kubernetes distributions with different create, delete, get, list, and update operations.
All of the operations (create/delete/get/list/update) coarsely lead to the same ranking of the lightweight K8s distributions. MicroK8s shows the longest latencies for the different operations. Its Dqlite database is a distributed version of SQLite that can scale horizontally and uses C-Raft – an optimized Raft implementation in C – as the consensus algorithm. It could be that the longer latencies for MicroK8s are related to the Raft algorithm that ensures data consistency in a cluster, whereas SQLite might not need any locking in this scenario with a single controller node.
Data Plane Performance
Results from the memtier_benchmark utility from the data plane experiments compared with K-Bench showed MicroShift had the lowest latencies and the highest throughput (Figure 7). The average latency for the database operations lies between 10 and 19ms on average, with few outliers going up to 174ms. MicroShift was the fastest distribution, showing average latencies 15 percent shorter than MicroK8s and 38 percent shorter than K3s. The achieved throughput is a consequence of the latencies, so MicroShift also has the highest numbers for throughput operations.
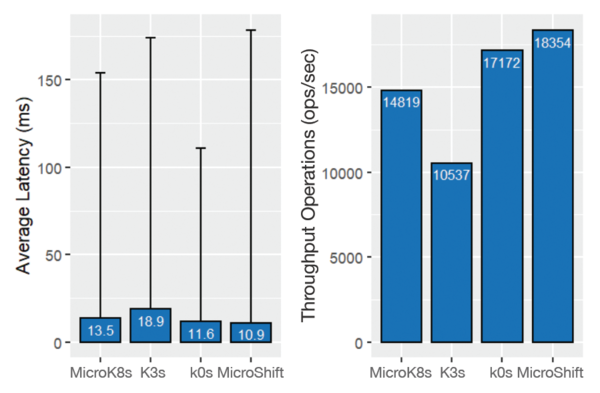 Figure 7: Performance comparison results collected by memtier for average latency and throughput operations of all Kubernetes distributions (k0s, K3s, MicroShift, MicroK8s).
The data plane performance experiments used the same container (Nginx), same application (memtier), same workload, and same hardware. Because these experiments hardly had any control plane operations, a major factor contributing to the results is the container runtime.
MicroShift uses CRI-O, whereas the other distributions use containerd. MicroShift executed on Red Hat Enterprise Linux (RHEL) instead of Ubuntu, which could also influence the results. Furthermore, as seen in Figure 3, each distribution has a considerable CPU overhead, even when idle, which might explain the comparably poor data plane performance results for K3s, which also had the highest controller CPU utilization in the idle experiments.

Read this article on our new ADMIN website
https://www.admin-it.io/empowering-kubernetes-capabilities-with-lightweight-k8s-distros/
Buy this article as PDF
(incl. VAT)
Buy ADMIN Magazine
Related content
- Canonical Releases Autonomous Clustering with MicroK8s
-
Simple, small-scale Kubernetes distributions for the edge
 We look at three scaled-down, compact Kubernetes distributions for operation on edge devices or in small branch office environments.
 -
Zero-Ops Kubernetes with MicroK8s
 A zero-ops installation of Kubernetes with MicroK8s operates on almost no compute capacity and roughly 700MB of RAM.
 -
Strengths and Weaknesses of Docker Swarm and Kubernetes
 Docker Swarm and Kubernetes both orchestrate container clusters, manage workloads, improve reliability, and automate the operation of distributed applications, but they are based on different architectures. We compare the two platforms, highlighting their benefits and downsides.
 -
News for Admins
In the news: Red Hat Enterprise Linux 8.3 Available, It's Official – Linux 5.10 is the Next LTS Kernel, System76 Unleashes World's Smallest Quad-GPU Workstation, Canonical Releases Autonomous Clustering with MicroK8s.
Subscribe to our ADMIN Newsletters
Subscribe to our Linux Newsletters
Find Linux and Open Source Jobs
Most Popular
Focus On Self-Hosting
• Reliable Network Storage with TrueNAS Community Edition
• Self-Hosted File Syncing with Seafile
• Wiring the Modern Stack with Node-RED
• Self-Hosted Collaboration with Forgejo
• Self-Hosted PaaS with Coolify
• Build and Host Docker Images
• Self-Hosted Pritunl VPN Server with MFA
Support Our Work
ADMIN content is made possible with support from readers like you. Please consider contributing when you've found an article to be beneficial.