More TUI Tools for HPC Users
Graphical user interface (GUI) tools are wonderful, but for those times when I encounter issues working on HPC systems that only allow terminal access, I need to know about tools for text-based user interfaces (TUIs). In this article, I write about three TUI tools I just came across. I should have encountered them earlier, but I stuck to command-line interface (CLI) tools and didn't bother to look for TUI equivalents (shame on me). I think tools for all three – GUI, TUI, and CLI – can be useful for HPC users.
You could make a good argument that that the first two TUI tools are really CLI tools, but I think of them as TUIs because of their ASCII presentation.
cpufetch
Have you ever gotten onto a system and been curious about the CPU capability? This has happened to me on several occasions where I got an account on an HPC system with little to no information about the compute nodes, much less the login nodes. I usually end up using the commands
$ cat /proc/cpuinfo
$ cat /proc/meminfo
to get information on the CPU and memory. Because these commands are always issued on the login node, I have to create a simple job to run them. However, the output from the cpuinfo command can be quite long.
Instead, my simple job can use the cpufetch command. Figure 1 shows example output of the cpufetch command on my laptop.
 Figure 1: Output from cpufetch.
Note that for this example, cpufetch distinguishes between performance cores (P-cores) and efficiency cores (E-cores), with useful information about the two classes of cores:
- maximum frequency
- supported AVX extensions
- fused multiply-add (FMA) type
- L1 (instruction and data) information
- L2 cache size
- L3 cache size
- estimated peak performance
The cpufetch command works for several architectures and on several operating systems, but not all combinations. In general, it can discover information about x86/x86_64, RISC-V, and PowerPC, but not on all operating systems. The command runs on Linux, Windows (no versions specified), Android, macOS, and FreeBSD, but not for all architectures. I’ve only tested the command on Linux.
The code has had some updates within the last year, but some updates are about four years old. Nonetheless, it produced correct output for the Intel CPU I used in my test, although I did get two Unknown microarchitecture detected messages (not shown in Figure 1). Newer architectures appear to need updates, as supported by open issues on GitHub. However, it still produces useful output.
gpufetch
The author of cpufetch also wrote gpufetch . As you can imagine, it’s designed to present information about system GPUs in a clear format and can be used on Intel iGPUs, which are better than or equal to Gen6, and NVIDIA GPUs with a compute capability greater than or equal to 2.0. Unlike cpufetch , gpufetch has not been updated in a while and is not in the standard Ubuntu repositories (although it might be in repositories for other Linux distributions). However, you can easily build gpufetch with the NVIDIA HPC SDK for NVIDIA GPUs, which I test here. Figure 2 is a screenshot of the output from gpufetch on my laptop.
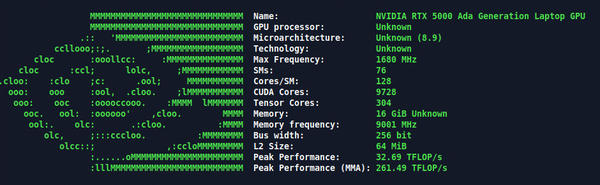 Figure 2: Output from gpufetch.
You can tell that gpufetch needs updating, because it doesn’t know the GPU processor or the microarchitecture and technology; however, it does give you some reasonable details, including:
-
- max frequency
- number of Streaming Multiprocessors (SMs)
- number of cores in an SM
- number of Tensor Cores
- amount of memory (some missing details)
- GPU memory frequency
- bus width (number of bits)
- L2 cache size
- estimated peak performance
- estimated peak performance (MMA) – warp sync Tensor Core-based matrix multiply and accumulate)
Slurm
Slurm is likely the most popular resource manager (job scheduler) in HPC. It is also heavily used in AI. Although the use of Slurm is straightforward, you might have to use several commands along with some filtering and processing to get a view of what you want. For HPC users, this can be a problem when all you want to do is run your application without the need or desire to learn the details of Slurm. An easy-to-use solution is stui , a Slurm dashboard for the terminal. This TUI application monitors the Slurm resource manager (Figure 3).
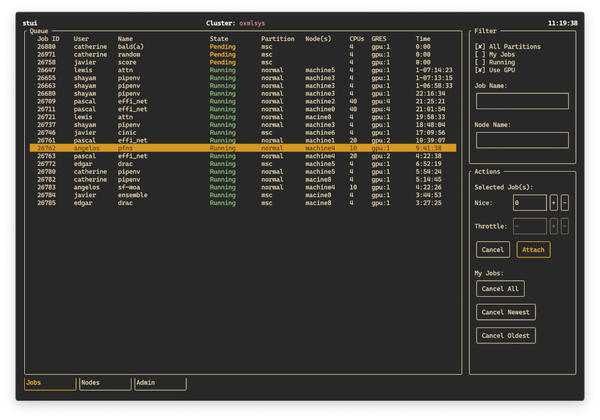 Figure 3: Screenshot of stui from the GitHub project page.
The options in the top right allow you to filter the information shown on the main page of the TUI by clicking on the combinations you want, specifying a particular job number, or specifying a particular node (which is useful if multiple users can be on the same compute node with Slurm).
The main part of the TUI, the large portion on the left-hand side, has details of the jobs based on your filter choices. The column layout shows
-
- Job ID
- User – username
- Name – job name
- State – whether the job is Running, Pending, Completing, Completed, Failed, or Terminated
- Partition – the partition to which the job belongs
- Node(s) – the node used by the job
- CPUs – number of CPUs used
- GRES – any General Resources being used (typically GPUs)
- Time – wall clock time used by the job
This easy-to-read table alone gives you a huge amount of information and could be used to tell you which nodes are not being used or which jobs have been running the longest (and are most likely to finish soon). You can also manipulate your jobs from the Actions menu box in the lower right corner. For example, you can select jobs in the main window and then go to the Actions window and Nice the job (lower its priority, so more CPU resources can be allocated to interactive processes and ensure that background jobs do not negatively affect other users).
In the lower part of the Actions window, you can cancel all of your jobs, only cancel the newest job, or only cancel the oldest job. These options can be very handy if you need to cancel (kill) jobs for any reason.
The Nodes and Admin tabs at the bottom of the left-hand pane are placeholders. If you click on them, they will say something like Under Construction .
Summary
I love TUI interfaces; their presentation is handy for visual learners, plus, they tend to be very fast, especially compared with some network-based GUIs, which can slow down your work. If you are limited to just a terminal, you can still use a TUI. TUIs aren’t perfect, though. Displaying graphical information such as plots is difficult or virtually impossible.
In this article, I presented two new TUIs that give you information about the CPU and GPU in a system. If you find yourself on a new system with unknown capabilities (e.g., login nodes – what kind of capability do they have to prep my applications for running on an HPC system?) or that has different types of nodes (even if you know which nodes you will be using for your applications), cpufetch and gpufetch can give you some useful information. The downside of these tools is that they are starting to get a little stale and need to be updated. Is anyone up for a fork?
Saving the best for last, the Slurm TUI, stui , is a really great way to interact with Slurm. You get tons of information about the states of jobs, especially your own. Just starting up the TUI with the default data shown in the left-hand pane provides a great way to visualize what’s going on (IMHO). Although command-line tools for Slurm such as squeue can get some of this information, I like the TUI because it is more interactive.
Related content
-
Resource Management with Slurm

One way to share HPC systems among several users is to use a software tool called a resource manager. Slurm, probably the most common job scheduler in use today, is open source, scalable, and easy to install and customize.
-
Resource Management with Slurm
 One way to share HPC systems among several users is to use a software tool called a resource manager. Slurm, probably the most common job scheduler in use today, is open source, scalable, and easy to install and customize.
 -
Building a HPC cluster with Warewulf 4
 Warewulf installed with a compute node is not really an HPC cluster; you need to ensure precise time keeping and add a resource manager.
 -
Warewulf 4 – Time and Resource Management

Warewulf installed with a compute node is not really an HPC cluster; you need to ensure precise time keeping and add a resource manager.
-
Warewulf 4 – GPUs

Install NVIDIA GPU drivers on the head and compute nodes.
Subscribe to our ADMIN Newsletters
Subscribe to our Linux Newsletters
Find Linux and Open Source Jobs
Most Popular
Support Our Work
ADMIN content is made possible with support from readers like you. Please consider contributing when you've found an article to be beneficial.
